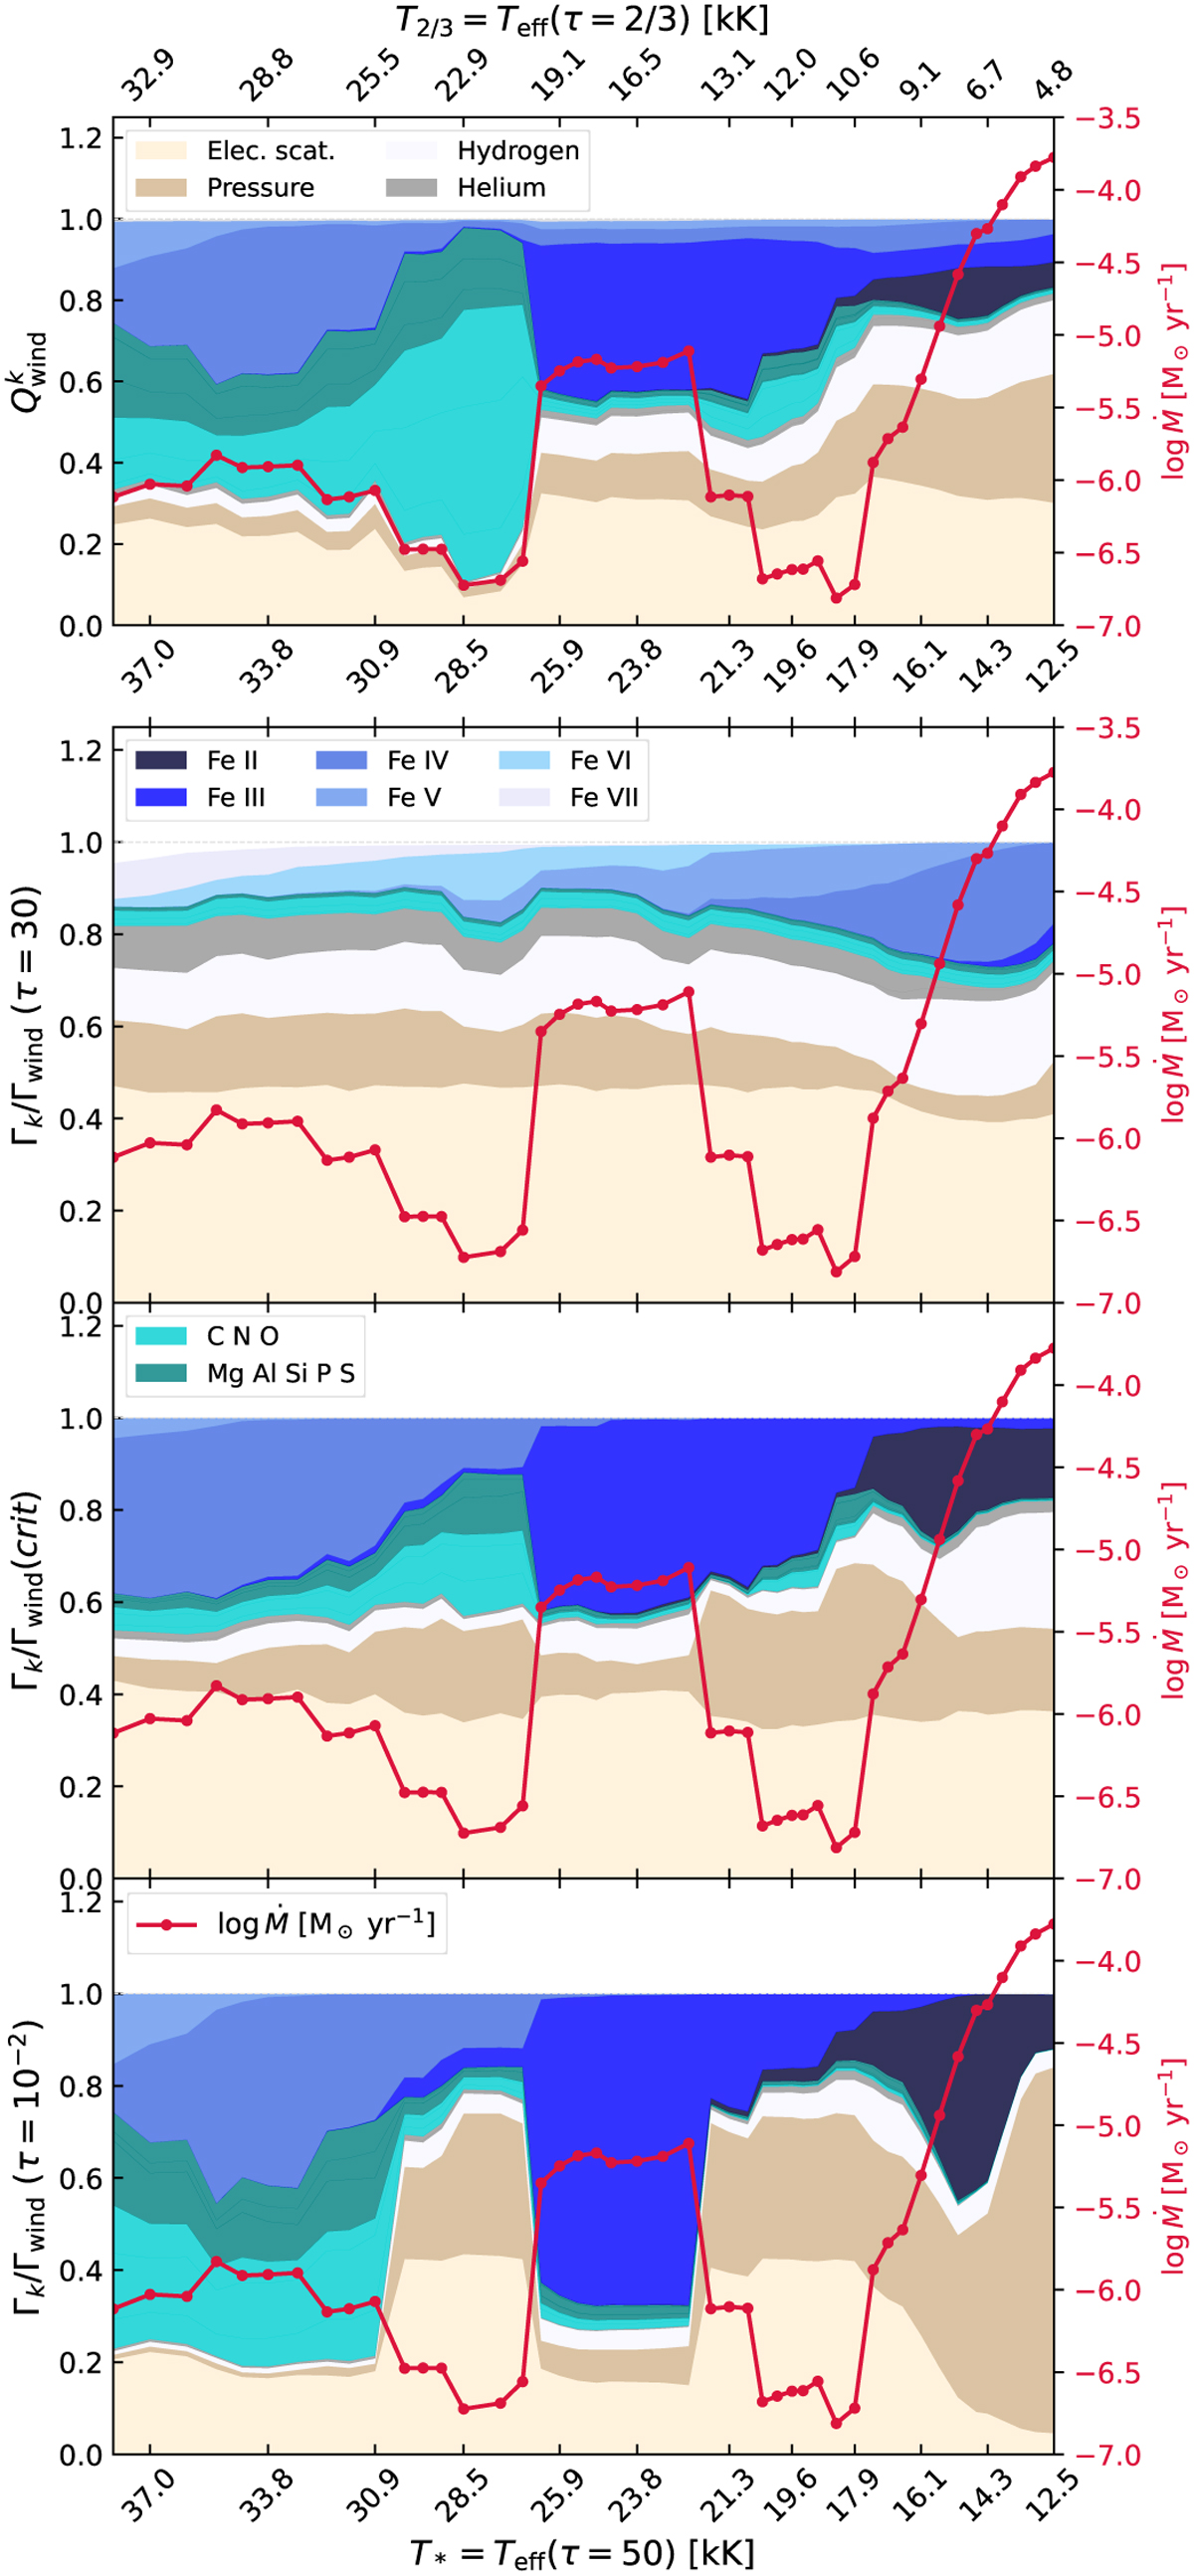
Fig. B.1
Download original image
Upper panel: Contribution of different processes, elements, and ions to the wind work ratio Qwind. The other panels indicate each contribution to the wind driving at specific depths – namely, at τ=30 (near the inner boundary), τ=τcrit (where the wind is launched, like in Fig. 5), and τ=0.01 (far out in the wind). The color code is the same of Fig. 5.
Current usage metrics show cumulative count of Article Views (full-text article views including HTML views, PDF and ePub downloads, according to the available data) and Abstracts Views on Vision4Press platform.
Data correspond to usage on the plateform after 2015. The current usage metrics is available 48-96 hours after online publication and is updated daily on week days.
Initial download of the metrics may take a while.