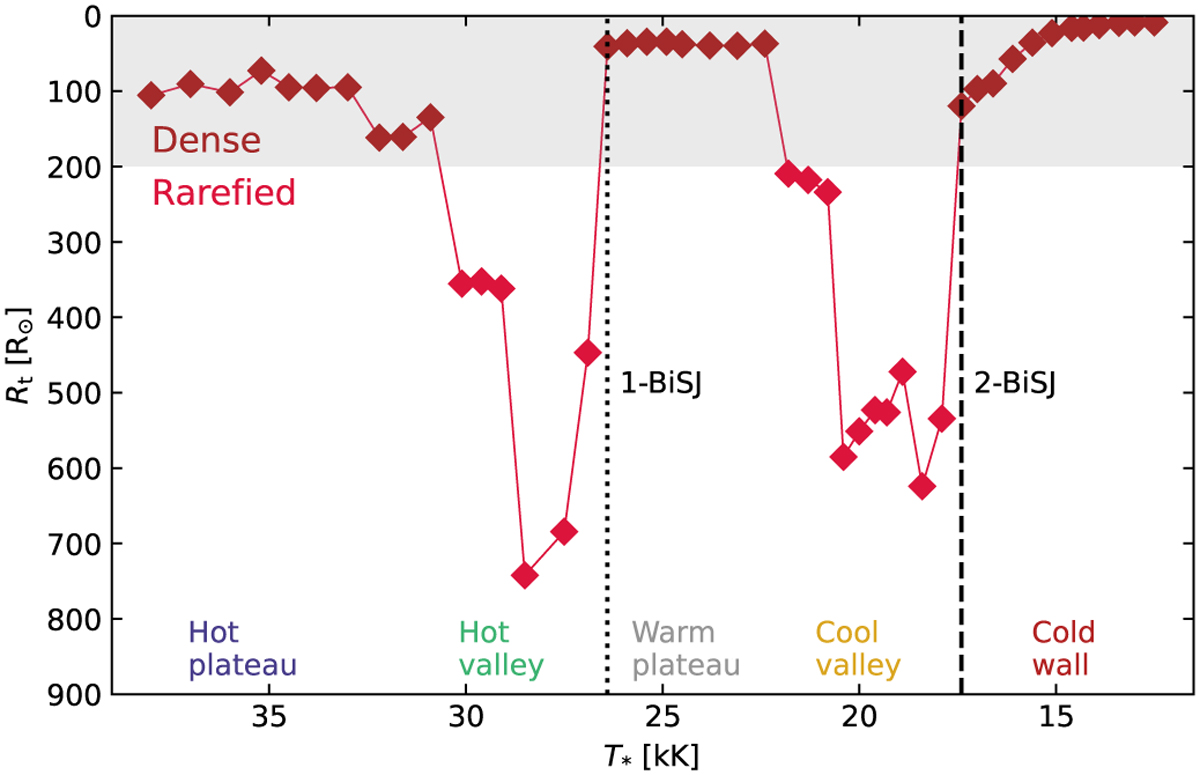
Fig. 4
Download original image
Transformed radius (Rt) vs. T*. Models with Rt<200 R⊙ are in the dense-wind regime, i.e., with higher Ṁ and optical spectra crowded with emission and P Cygni features (shaded region). The colored texts in the lower part of the diagram name the wind-solution regions identified in the T* sequence. The 1-BiSJ and the 2-BiSJ are indicated by the dotted and dashed lines in the transitions from a valley to a plateau (i.e., increase in Ṁ) toward lower T*.
Current usage metrics show cumulative count of Article Views (full-text article views including HTML views, PDF and ePub downloads, according to the available data) and Abstracts Views on Vision4Press platform.
Data correspond to usage on the plateform after 2015. The current usage metrics is available 48-96 hours after online publication and is updated daily on week days.
Initial download of the metrics may take a while.