Fig. 5
Download original image
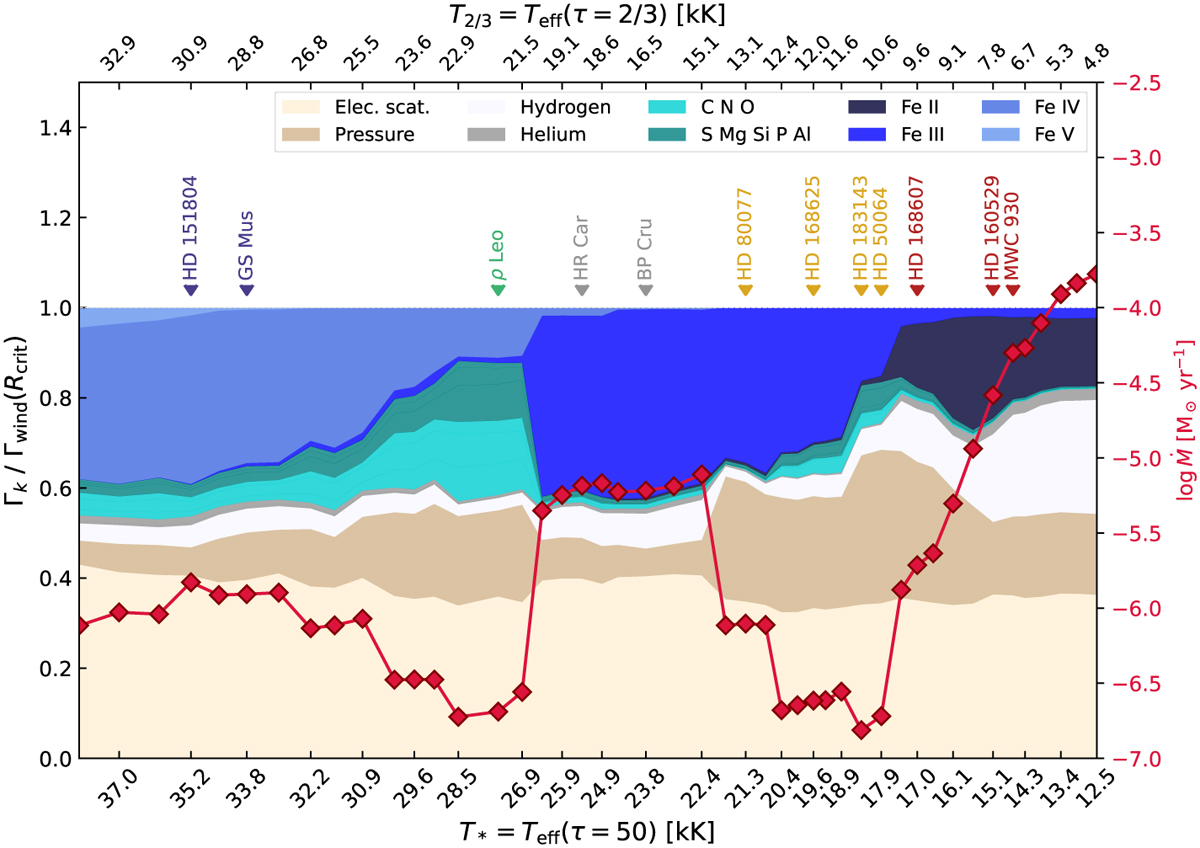
Contributions of different processes, elements, and ions to the wind launching at the critical point (stacked area plot) and corresponding mass-loss rates (red line) for different inner boundary temperatures (T*). From bottom to top, the light beige area indicates the electron-scattering acceleration, dark beige shows the pressure, and smoke white indicates H i continuum driving. The teal tones indicate the contribution of CNO and other metals, and the shades of blue indicate the contributions of different Fe ions.
Current usage metrics show cumulative count of Article Views (full-text article views including HTML views, PDF and ePub downloads, according to the available data) and Abstracts Views on Vision4Press platform.
Data correspond to usage on the plateform after 2015. The current usage metrics is available 48-96 hours after online publication and is updated daily on week days.
Initial download of the metrics may take a while.