Fig. 8
Download original image
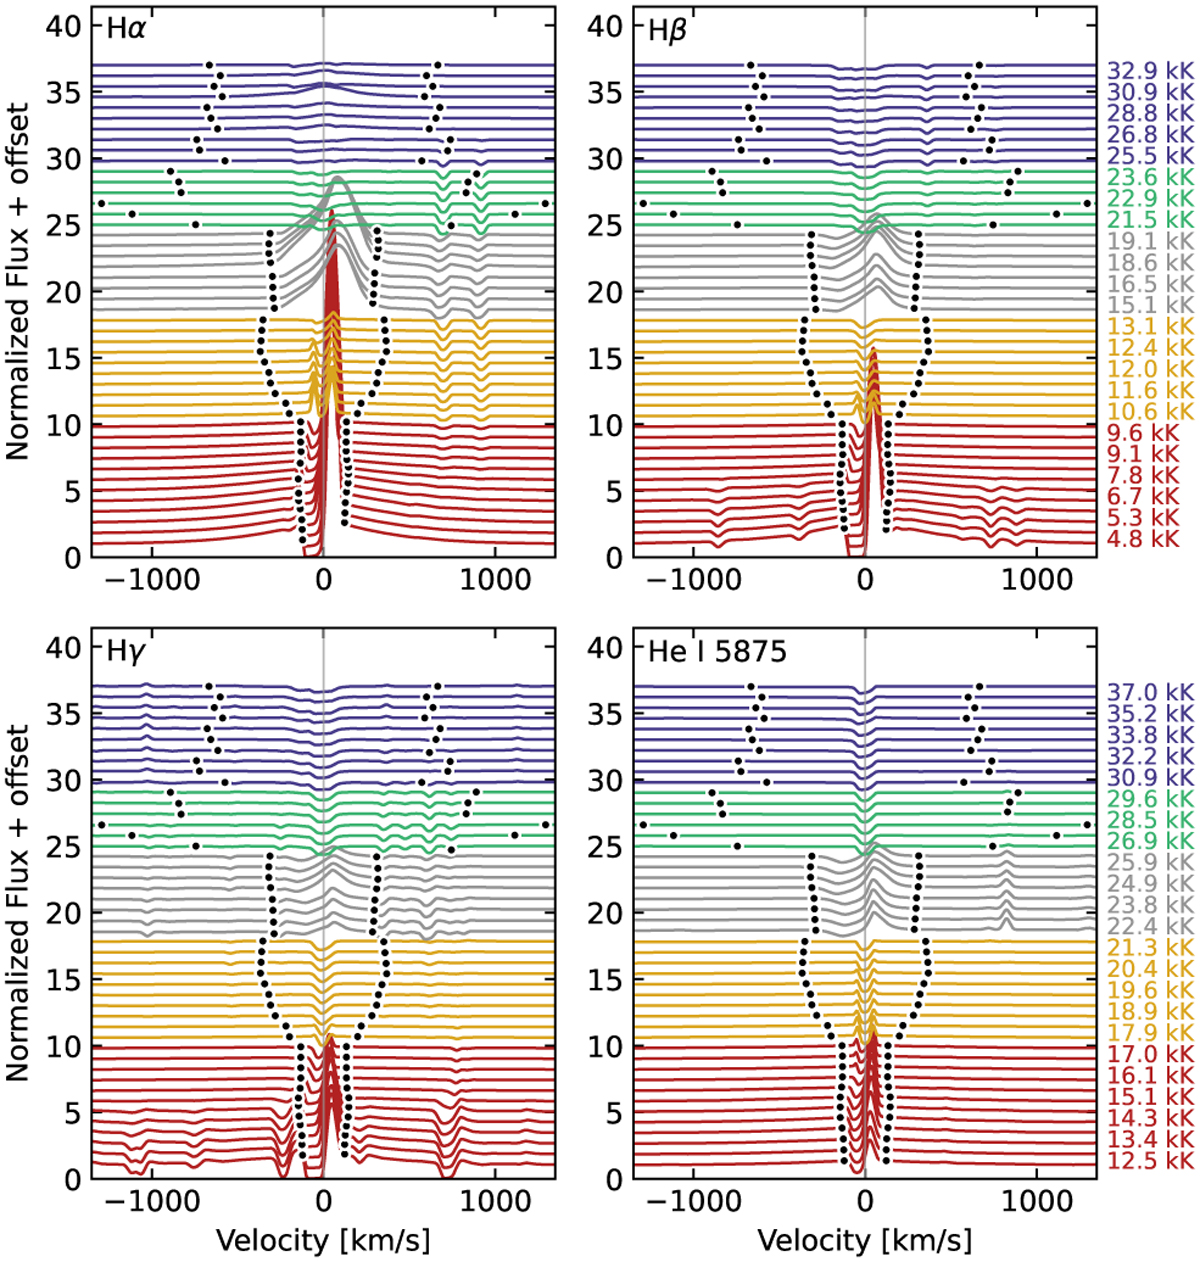
Hydrogen and helium profiles in velocity space compared to the terminal velocity (black dots). The color of each spectrum marks the wind-solution regime to which the model belongs, following the same color scheme as Fig. 7. The temperatures rightward in the upper panels indicate T2/3, and rightward in the lower panel, they indicate T*.
Current usage metrics show cumulative count of Article Views (full-text article views including HTML views, PDF and ePub downloads, according to the available data) and Abstracts Views on Vision4Press platform.
Data correspond to usage on the plateform after 2015. The current usage metrics is available 48-96 hours after online publication and is updated daily on week days.
Initial download of the metrics may take a while.