Fig. 9
Download original image
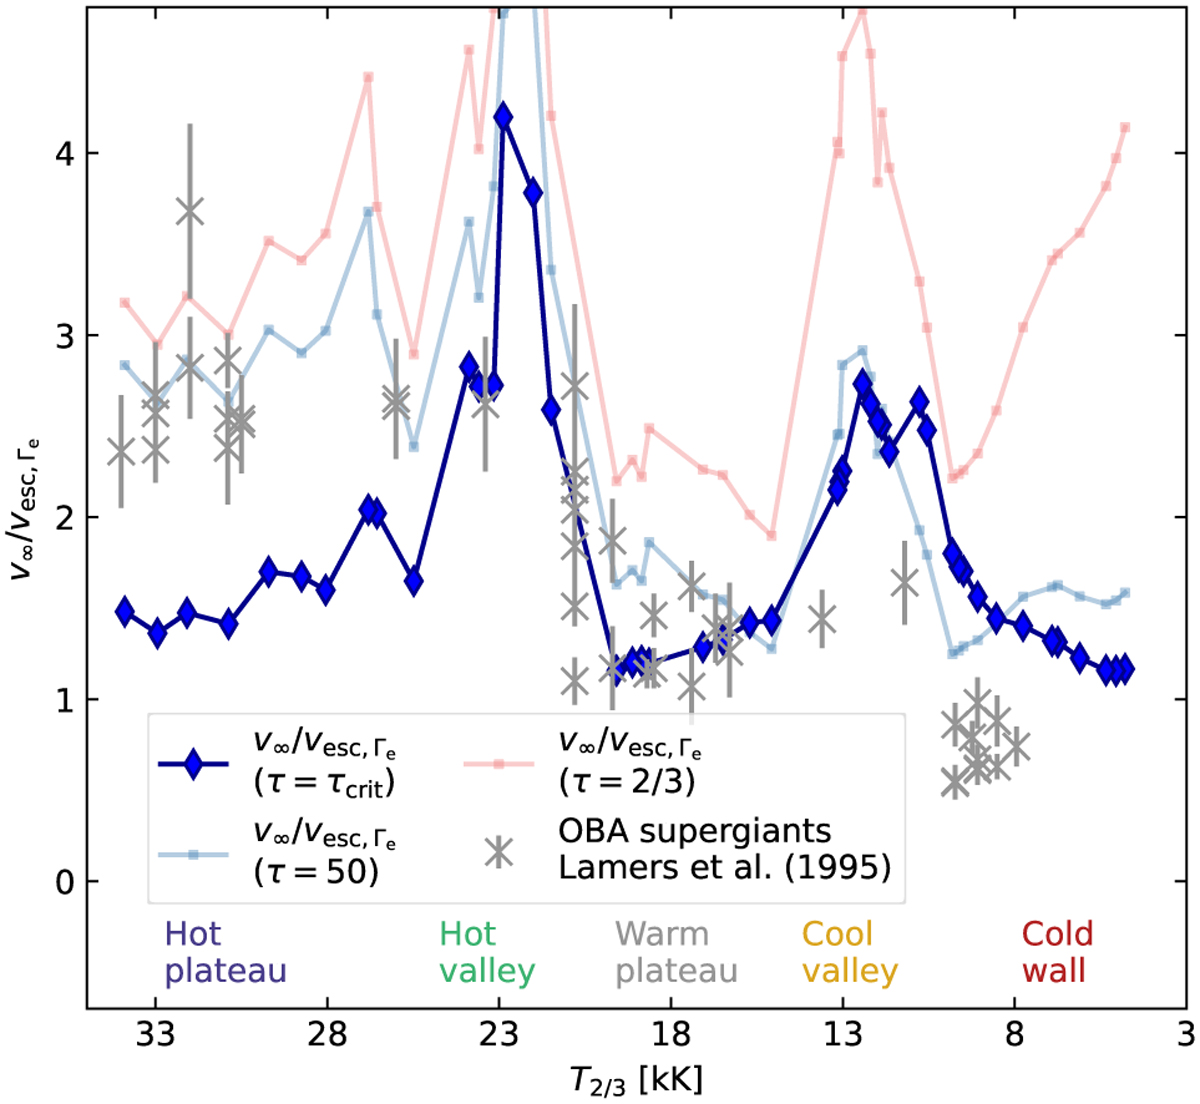
Behavior of the v∞/vesc,Γe relation. The gray crosses indicate the data of Lamers et al. (1995) for OBA supergiants. The blue curve with diamonds indicates the values for vesc,Γe applied to the critical point. The pink curve indicates the ratio at τ=2/3, and the thin light blue curve indicates the ratio at τ=50, i.e., the inner boundary.
Current usage metrics show cumulative count of Article Views (full-text article views including HTML views, PDF and ePub downloads, according to the available data) and Abstracts Views on Vision4Press platform.
Data correspond to usage on the plateform after 2015. The current usage metrics is available 48-96 hours after online publication and is updated daily on week days.
Initial download of the metrics may take a while.