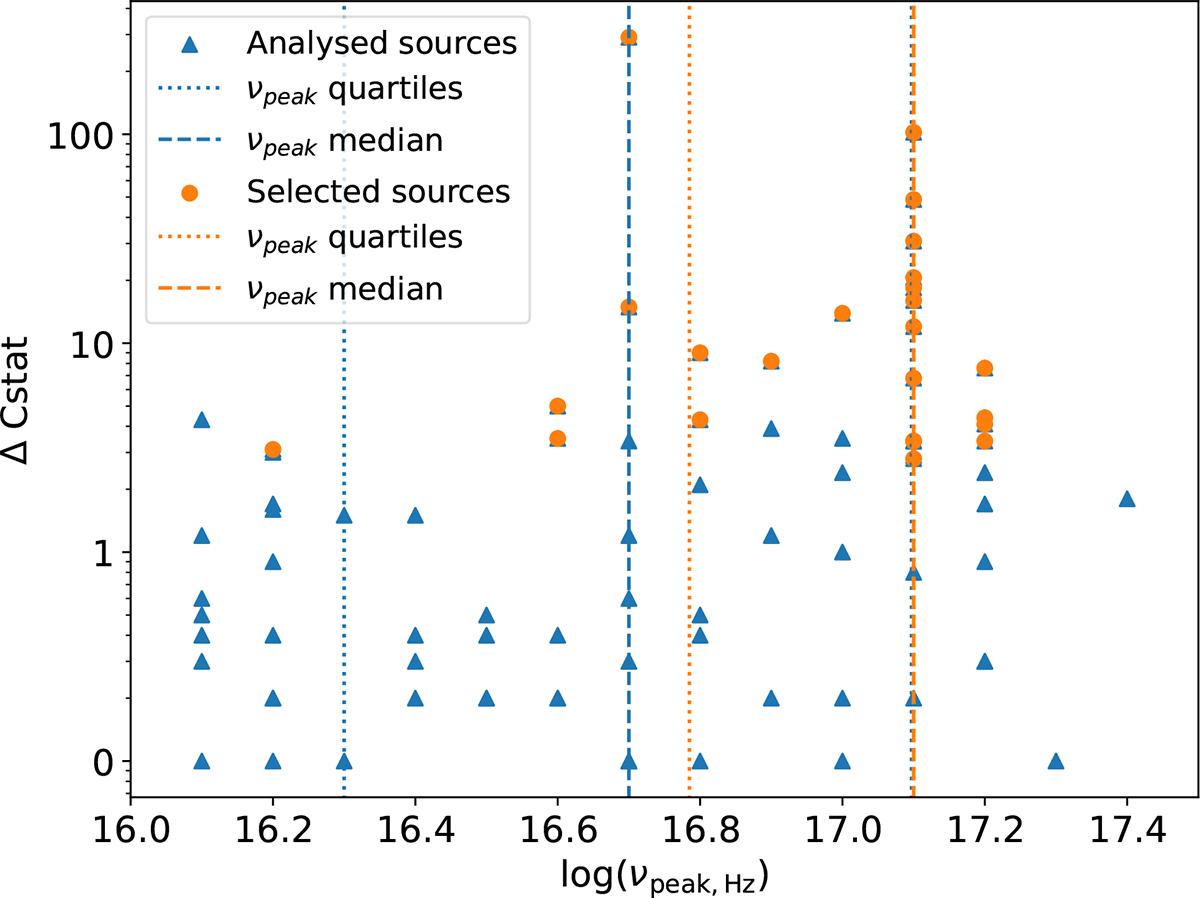
Fig. 4.
Download original image
Distribution of the ΔCstat of the analysed sources plotted against their synchrotron peak. The blue triangles represent the results for all the analysed sources, whereas the orange circles represent the sources favouring a log parabola fit, having ΔCstat > 2.7 and –1 < β < 1.5. The dotted lines represent the quartiles and median distribution for the two populations. As it can be seen, the sources best fitted with a log parabola model tend to have slightly larger synchrotron peak frequency.
Current usage metrics show cumulative count of Article Views (full-text article views including HTML views, PDF and ePub downloads, according to the available data) and Abstracts Views on Vision4Press platform.
Data correspond to usage on the plateform after 2015. The current usage metrics is available 48-96 hours after online publication and is updated daily on week days.
Initial download of the metrics may take a while.