Fig. 12
Download original image
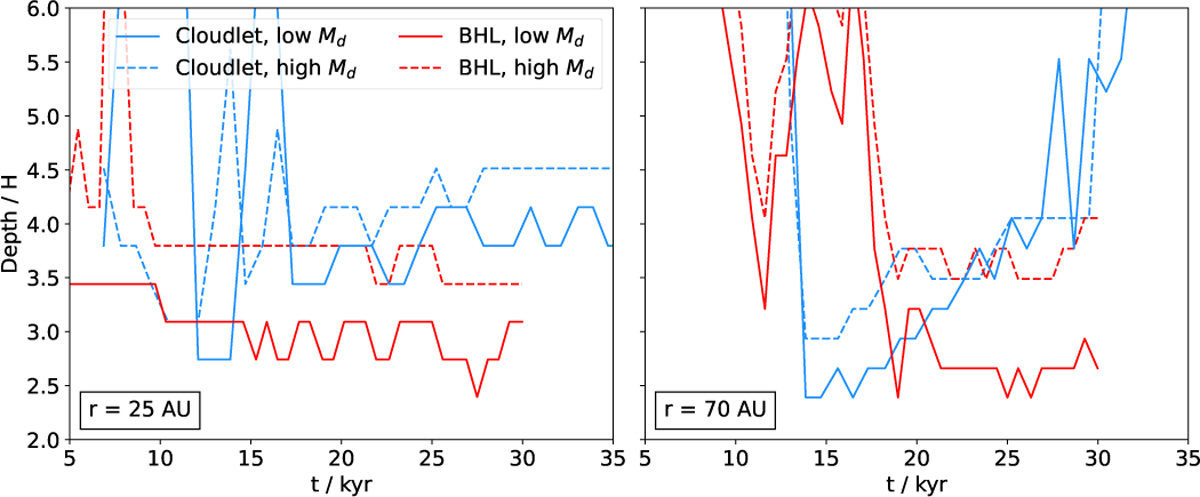
Perturbation depth in units of the pressure scale height as a function of time for all four simulations. The left panel shows the depth for the inner disk (r = 25 AU), and the right panel shows the depth for the outer disk (r = 70 AU). The dashed lines represent simulations with regular disk mass, solid lines ones with low disk mass. The blue lines describe cloudlet capture simulations, whereas the red lines describe accretion in a turbulent medium.
Current usage metrics show cumulative count of Article Views (full-text article views including HTML views, PDF and ePub downloads, according to the available data) and Abstracts Views on Vision4Press platform.
Data correspond to usage on the plateform after 2015. The current usage metrics is available 48-96 hours after online publication and is updated daily on week days.
Initial download of the metrics may take a while.