Fig. 3
Download original image
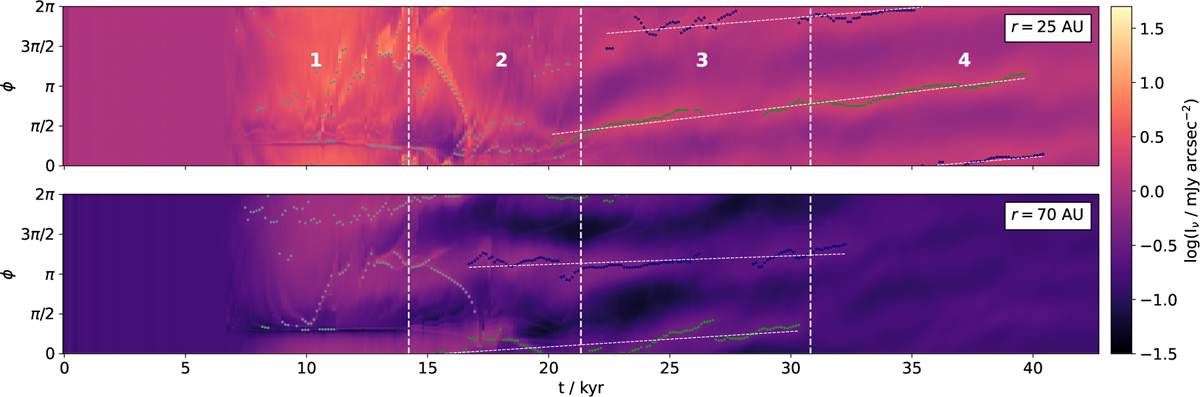
Polarized scattered-light intensity as a function of azimuth and time for two different radii. The dashed white lines and numbers denote the different encounter phases, as in Fig. 2. The colored dots show the azimuthal peaks in gray when they were not considered further, otherwise by membership to one of the spiral arms. The solid white lines show the linear fit used to determine the pattern speed.
Current usage metrics show cumulative count of Article Views (full-text article views including HTML views, PDF and ePub downloads, according to the available data) and Abstracts Views on Vision4Press platform.
Data correspond to usage on the plateform after 2015. The current usage metrics is available 48-96 hours after online publication and is updated daily on week days.
Initial download of the metrics may take a while.