Fig. 6
Download original image
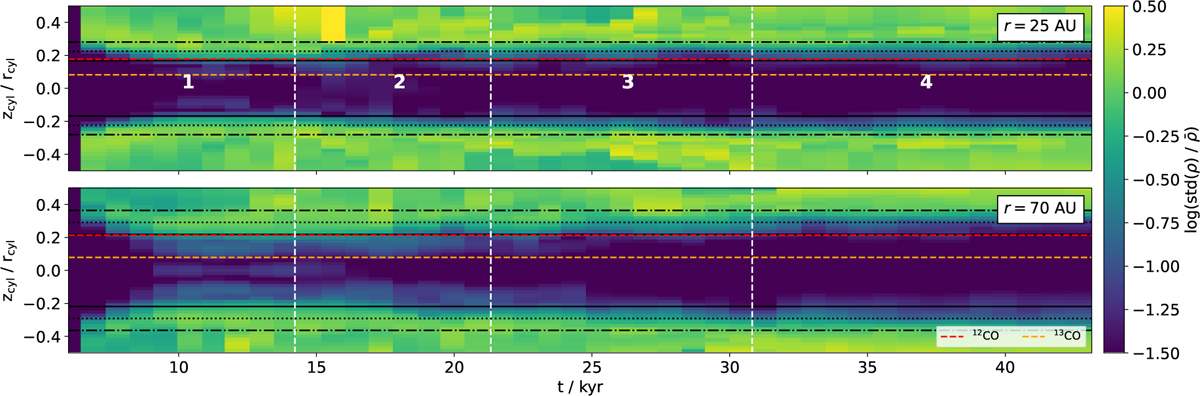
Coefficient of variation ![]() in azimuth as a function of time and height above the disk midplane. The dashed white lines denote the different phases of the encounter. The black lines represent three (solid), four (dotted), and five (dash-dotted) pressure scale heights. The coefficient is calculated for r = 25 AU and r = 70 AU, shown in the top and bottom panel, respectively. The dashed red, orange, and yellow lines denote the median in time of the τ = 2/3 emission surface of 12CO and 13CO, respectively.
in azimuth as a function of time and height above the disk midplane. The dashed white lines denote the different phases of the encounter. The black lines represent three (solid), four (dotted), and five (dash-dotted) pressure scale heights. The coefficient is calculated for r = 25 AU and r = 70 AU, shown in the top and bottom panel, respectively. The dashed red, orange, and yellow lines denote the median in time of the τ = 2/3 emission surface of 12CO and 13CO, respectively.
Current usage metrics show cumulative count of Article Views (full-text article views including HTML views, PDF and ePub downloads, according to the available data) and Abstracts Views on Vision4Press platform.
Data correspond to usage on the plateform after 2015. The current usage metrics is available 48-96 hours after online publication and is updated daily on week days.
Initial download of the metrics may take a while.