Fig. 1
Download original image
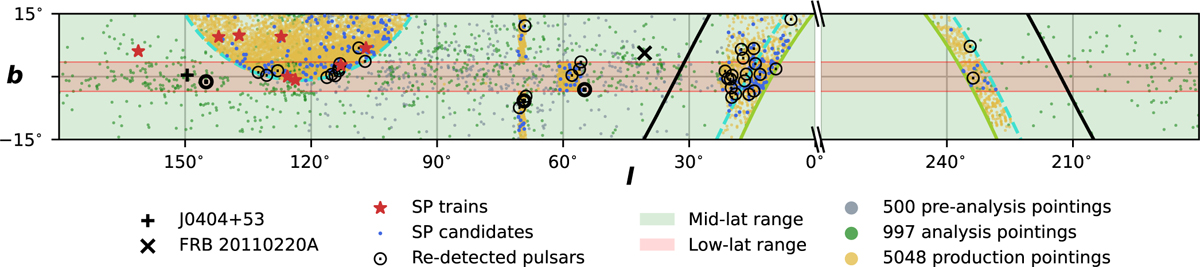
All currently processed HTRU-North PTs at the Galactic positions they cover. A PT’s relative area on the plot is equal to the area of the Effelsberg 7-beam receiver’s beam pattern on the sky. Overlaid are the new discoveries, SP trains, SP candidates, and known pulsar and RRAT re-detections. The pulsars shown in boldface are, from left to right, B0329+54, J2028+28, and B1942+17. The solid lime and dashed cyan lines are the declination limits of Effelsberg and FAST, respectively.
Current usage metrics show cumulative count of Article Views (full-text article views including HTML views, PDF and ePub downloads, according to the available data) and Abstracts Views on Vision4Press platform.
Data correspond to usage on the plateform after 2015. The current usage metrics is available 48-96 hours after online publication and is updated daily on week days.
Initial download of the metrics may take a while.