Fig. 2
Download original image
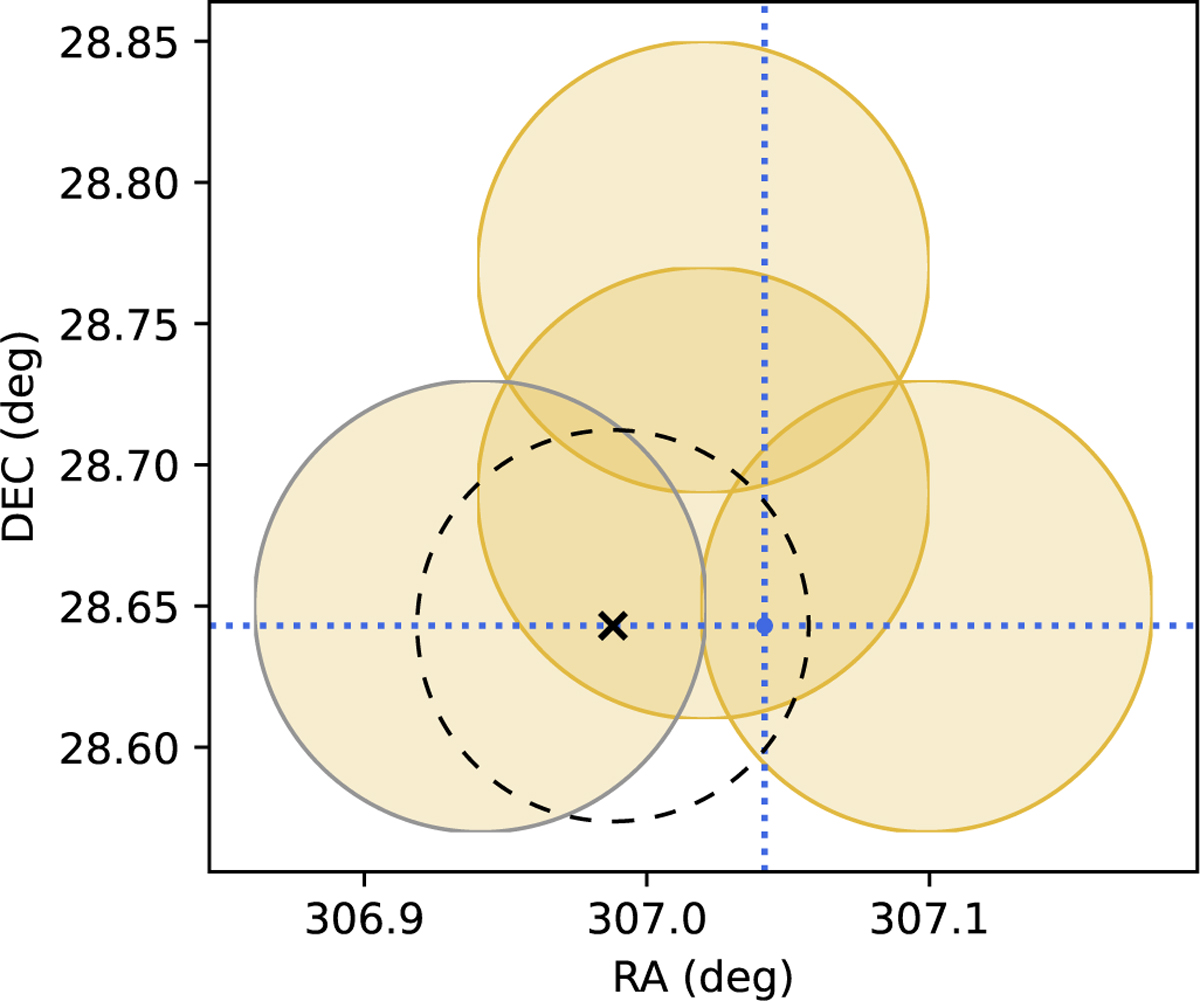
Grid pattern used to re-detect SPs from J2028+28 within its HTRU-North detection beam (the centre yellow circle). One SP was observed in the grey encircled scan. The dotted blue lines represent the semi-major and minor axes of CHIME/FRB’s tied-array beam, which is larger than the plotted area, centred on their reported position of J2028+28. The black cross marks the updated position for J2028+28 with an error radius of 0.07◦. Note that the lower scans seem to be spaced farther apart compared to the uppermost scan. This is a projection effect and is incorporated in the given error radius.
Current usage metrics show cumulative count of Article Views (full-text article views including HTML views, PDF and ePub downloads, according to the available data) and Abstracts Views on Vision4Press platform.
Data correspond to usage on the plateform after 2015. The current usage metrics is available 48-96 hours after online publication and is updated daily on week days.
Initial download of the metrics may take a while.