Fig. 3
Download original image
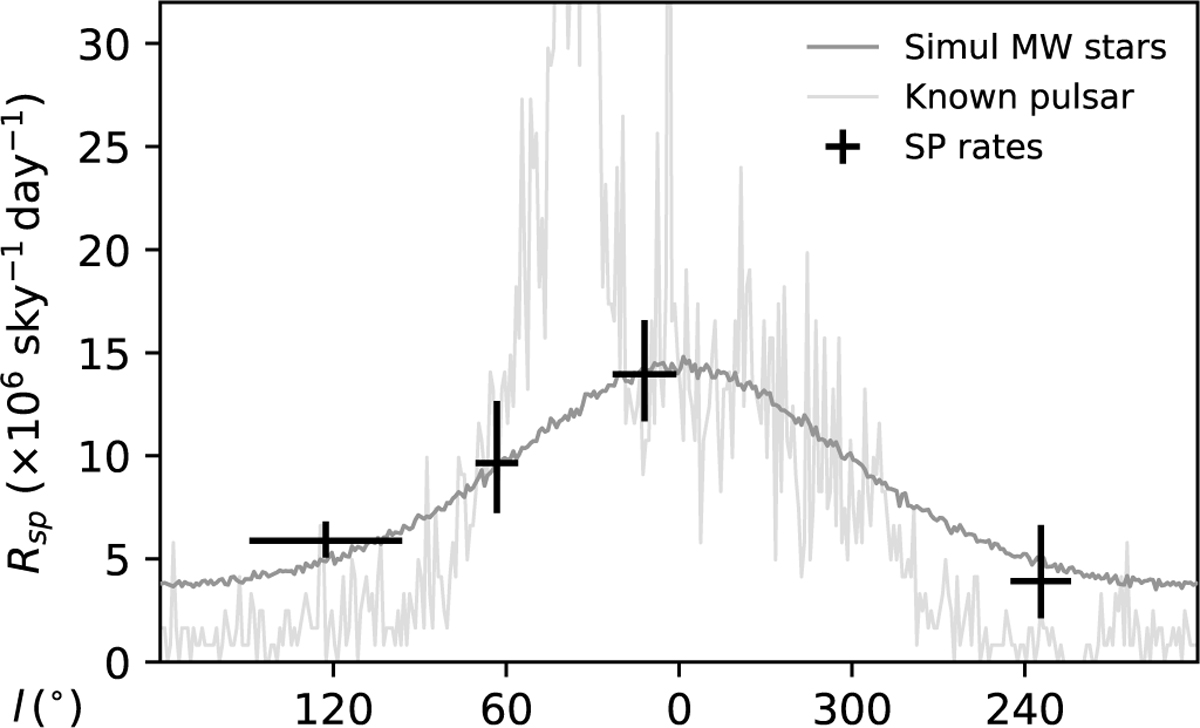
SP detection rate dependence on Galactic longitude. The longitude errors depict the longitude range of PTs with which the rates have been calculated. The rate errors are the 90% Poisson errors as given in Table 3. The simulated longitudinal distribution of stars in the Galactic disk is shown up to a distance of 2.2 kpc from the Sun together with the longitudinal distribution of known pulsars from PSRCAT. The stellar distribution is multiplied by a value ρ0 (Eq. (1)) such that it best describes the longitude rates. The pulsar distribution is given the same area as the stellar distribution.
Current usage metrics show cumulative count of Article Views (full-text article views including HTML views, PDF and ePub downloads, according to the available data) and Abstracts Views on Vision4Press platform.
Data correspond to usage on the plateform after 2015. The current usage metrics is available 48-96 hours after online publication and is updated daily on week days.
Initial download of the metrics may take a while.