Fig. 1
Download original image
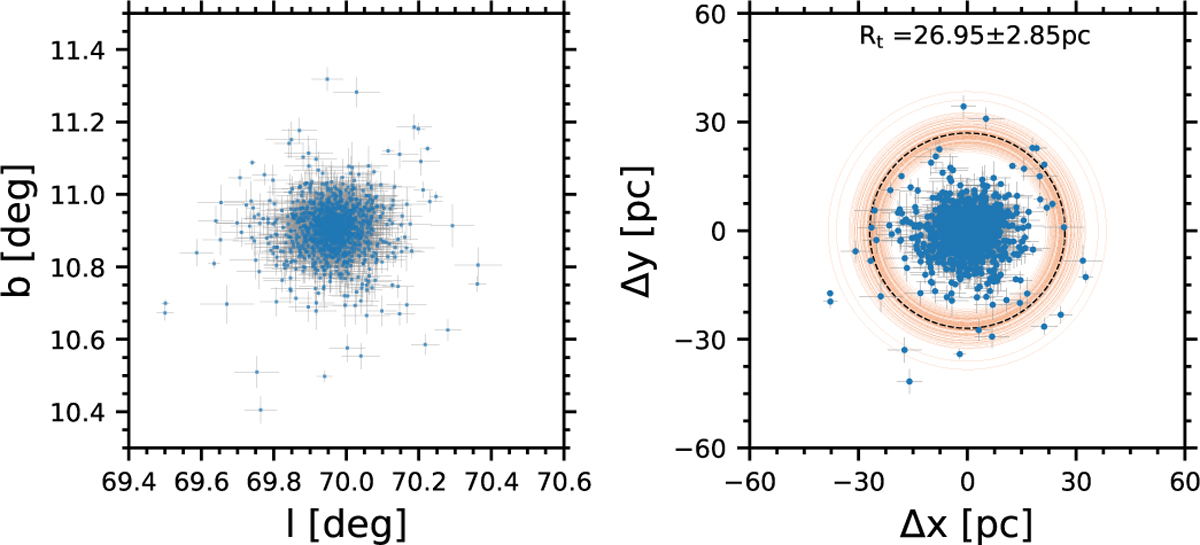
Distribution of NGC_6791 in the Galactic coordinate system (left panel) and its flattened projection distribution (right panel). The scattered blue points in each panel represent the member stars of the OC, with the gray bars being the errors of the position coordinates of its members. The orange circles correspond to the tidal radii obtained from 100 Monte Carlo sampling runs. The dashed black circle represents the mean value of the 100 results.
Current usage metrics show cumulative count of Article Views (full-text article views including HTML views, PDF and ePub downloads, according to the available data) and Abstracts Views on Vision4Press platform.
Data correspond to usage on the plateform after 2015. The current usage metrics is available 48-96 hours after online publication and is updated daily on week days.
Initial download of the metrics may take a while.