Fig. 18
Download original image
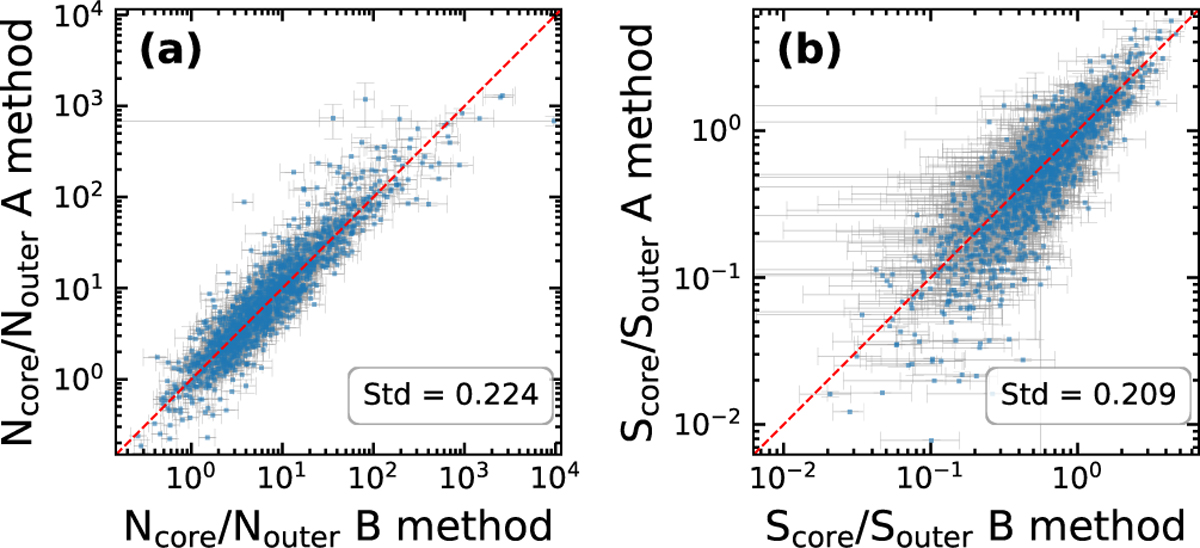
Comparison of the morphological stability parameters (left panel: Ncore/Nouter, right panel: Score/Souter) derived from two methods. Method A denotes sampling the tidal radius ten times, with Method B sampling the starting angle ten times. Dashed red lines indicate 1:1 correspondence. Error bars represent standard deviations.
Current usage metrics show cumulative count of Article Views (full-text article views including HTML views, PDF and ePub downloads, according to the available data) and Abstracts Views on Vision4Press platform.
Data correspond to usage on the plateform after 2015. The current usage metrics is available 48-96 hours after online publication and is updated daily on week days.
Initial download of the metrics may take a while.