Fig. 2
Download original image
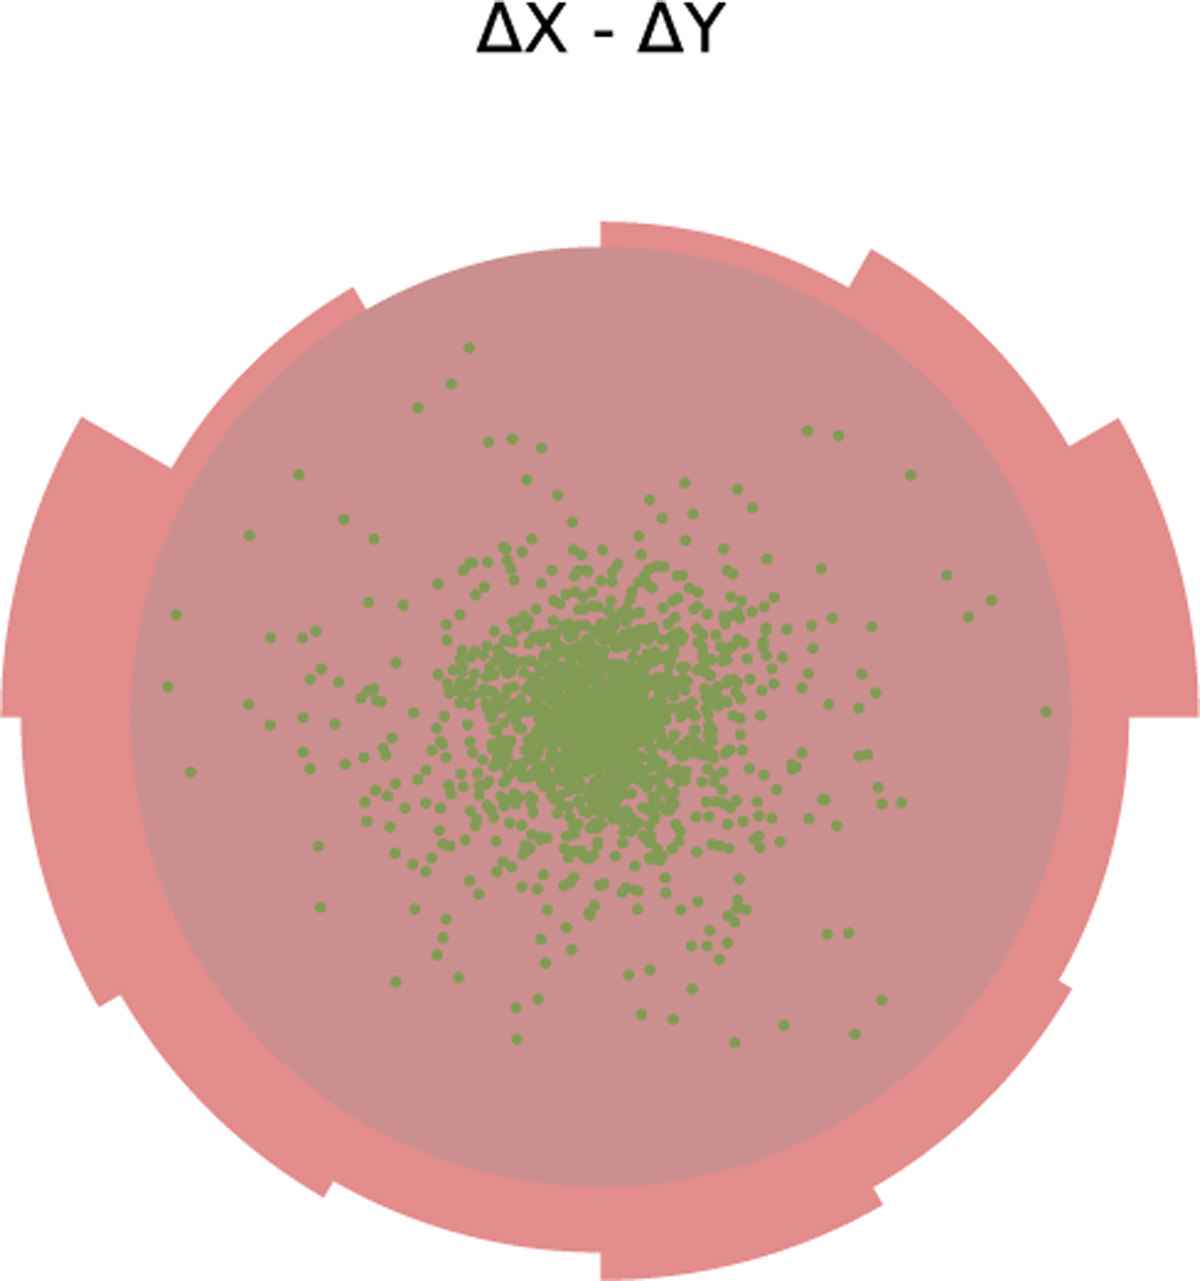
Rose diagram of the NGC_6791 on the 2D corrected projection, derived from one of ten samplings. The rose-colored sectors represent the normalized directional radial radius values obtained by the Rose diagram method. Each sector spans 30°, with the first sector starting at 0° corresponding to the horizontal line on the right of this diagram. The second sector begins at a position 30° counterclockwise from the first sector, and subsequent sectors follow this pattern. The semitransparent gray sectors are the average extension levels in each direction, with the scattered green points indicating the member stars.
Current usage metrics show cumulative count of Article Views (full-text article views including HTML views, PDF and ePub downloads, according to the available data) and Abstracts Views on Vision4Press platform.
Data correspond to usage on the plateform after 2015. The current usage metrics is available 48-96 hours after online publication and is updated daily on week days.
Initial download of the metrics may take a while.