Fig. 5
Download original image
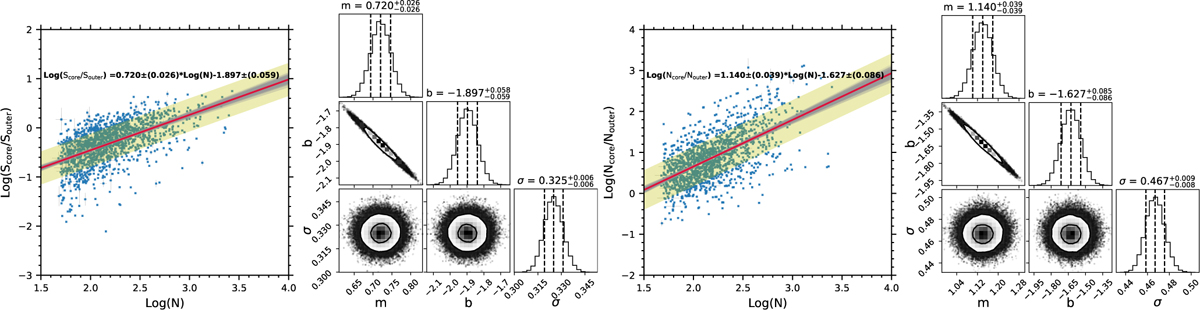
Relationships between the morphological stability parameters (Score/Souter: the first two panels from left to right; Ncore/Nouter: the last two panels) and the number of members (N). For ease of visualization, a logarithmic scale was adopted. Blue scatters in linear fitting panels represent our sample OCs, with the gray bars denoting their parameter errors. The faint gray lines show 1000 MCMC samples, with the thick red lines (the median values) and the shaded yellow bands (1σ) corresponding to our best parameter estimates. The two corner plots display the marginal posterior distributions (diagonal) and the 2D joint posterior contours (below diagonal) of the fit parameters (m, b, σ). Contours enclose the 1σ and 2σ confidence regions, and the median together with the 16th and 84th percentiles are quoted in each panel.
Current usage metrics show cumulative count of Article Views (full-text article views including HTML views, PDF and ePub downloads, according to the available data) and Abstracts Views on Vision4Press platform.
Data correspond to usage on the plateform after 2015. The current usage metrics is available 48-96 hours after online publication and is updated daily on week days.
Initial download of the metrics may take a while.