Fig. 1.
Download original image
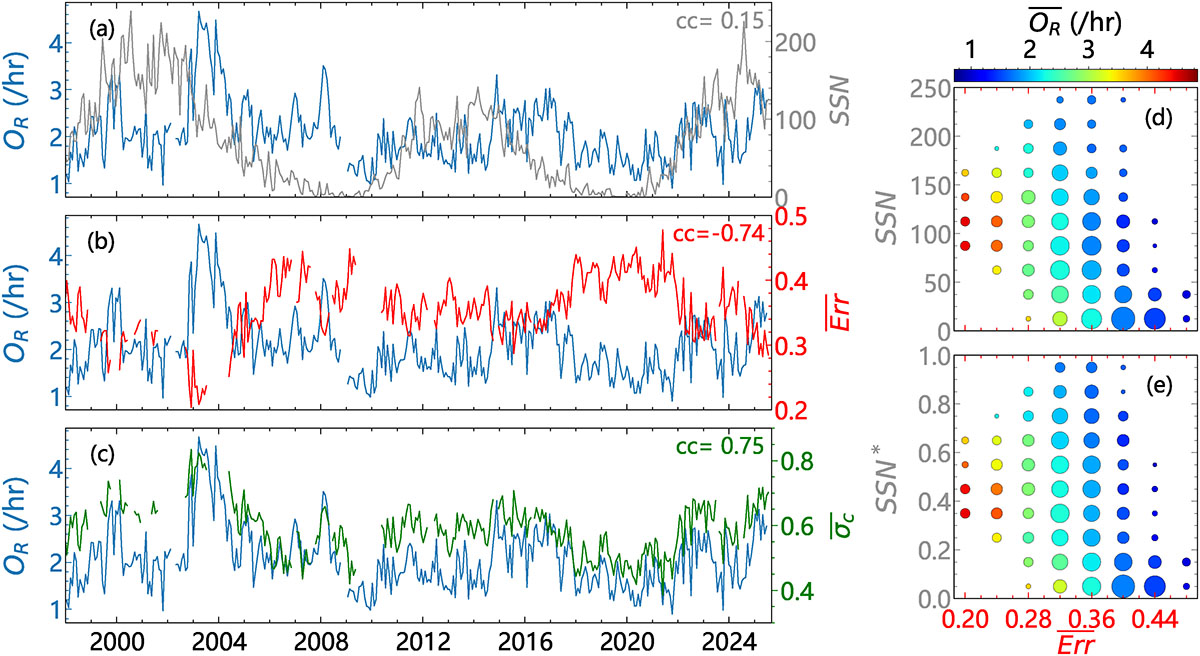
Temporal evolution and parameter correlations of the switchback occurrence rate. Left: 27-day sliding averages of the switchback occurrence rate (OR, blue) and sunspot number (SSN, gray) in panel (a), along with two Alfvénicity indices–![]() (red; panel (b)) and
(red; panel (b)) and ![]() (green; panel (c)). Panel (d): Bivariate distribution of
(green; panel (c)). Panel (d): Bivariate distribution of ![]() vs. SSN, with point size representing relative frequency and color indicating mean OR in each parameter bin. Panel (e): Same as (d), but with the y-axis replaced by the normalized SSN (denoted SSN*), obtained by dividing the SSN by its maximum value within each solar cycle.
vs. SSN, with point size representing relative frequency and color indicating mean OR in each parameter bin. Panel (e): Same as (d), but with the y-axis replaced by the normalized SSN (denoted SSN*), obtained by dividing the SSN by its maximum value within each solar cycle.
Current usage metrics show cumulative count of Article Views (full-text article views including HTML views, PDF and ePub downloads, according to the available data) and Abstracts Views on Vision4Press platform.
Data correspond to usage on the plateform after 2015. The current usage metrics is available 48-96 hours after online publication and is updated daily on week days.
Initial download of the metrics may take a while.