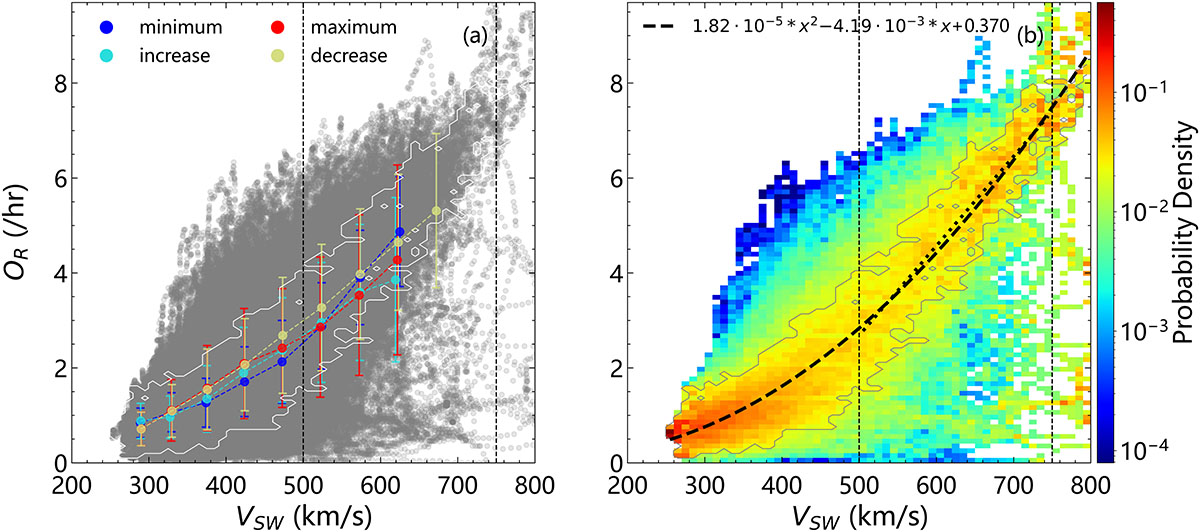
Fig. 2.
Download original image
Dependence of OR on solar wind speed (VSW). Panel (a): Scatter plot of OR vs. VSW using a 2-day sliding window (1-hour cadence), with overplotted averages and standard errors for solar maximum (red; 24 months before to 6 months after solar maxima in 2001-11-01, 2014-04-01, and 2024-08-01), solar minimum (blue; same window around solar minima in 1996-08-01, 2008-12-01, and 2019-12-01), as well as for the intermediate ascending and descending phases (light cyan and light lime). Panel (b): Conditional probability distributions of OR for different VSW ranges. The smoothing curve was fitted exclusively to the primary, contiguous high-density region (probability density > 0.02), whose outline is indicated by the white or gray contour in the figure. Minor, isolated regions were excluded from the fit.
Current usage metrics show cumulative count of Article Views (full-text article views including HTML views, PDF and ePub downloads, according to the available data) and Abstracts Views on Vision4Press platform.
Data correspond to usage on the plateform after 2015. The current usage metrics is available 48-96 hours after online publication and is updated daily on week days.
Initial download of the metrics may take a while.