Fig. 3.
Download original image
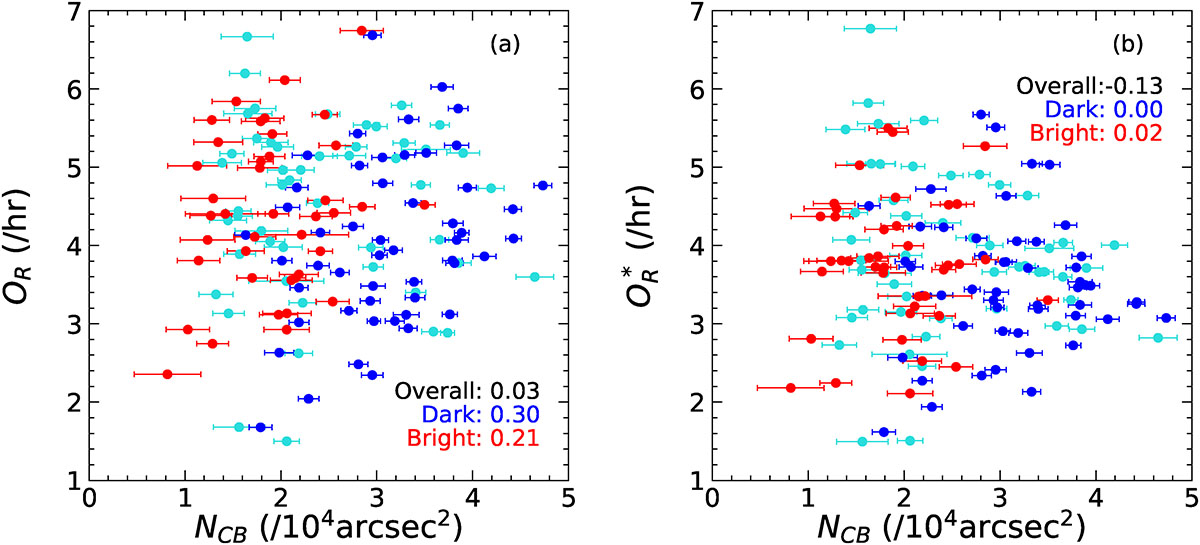
Panel (a): Relationship between OR and the number of brightening points per unit area within the primary CH NCB during HSS periods. The horizontal error bars indicate the ratio of the standard deviation to the mean. Panel (b): Same as (a), but with OR replaced by the corrected occurrence rate OR*, where OR* = OR ⋅ f(550)/f(VHSS), f is the fitting function from Fig. 2(b), and VHSS is the average solar wind speed during the HSS interval.
Current usage metrics show cumulative count of Article Views (full-text article views including HTML views, PDF and ePub downloads, according to the available data) and Abstracts Views on Vision4Press platform.
Data correspond to usage on the plateform after 2015. The current usage metrics is available 48-96 hours after online publication and is updated daily on week days.
Initial download of the metrics may take a while.