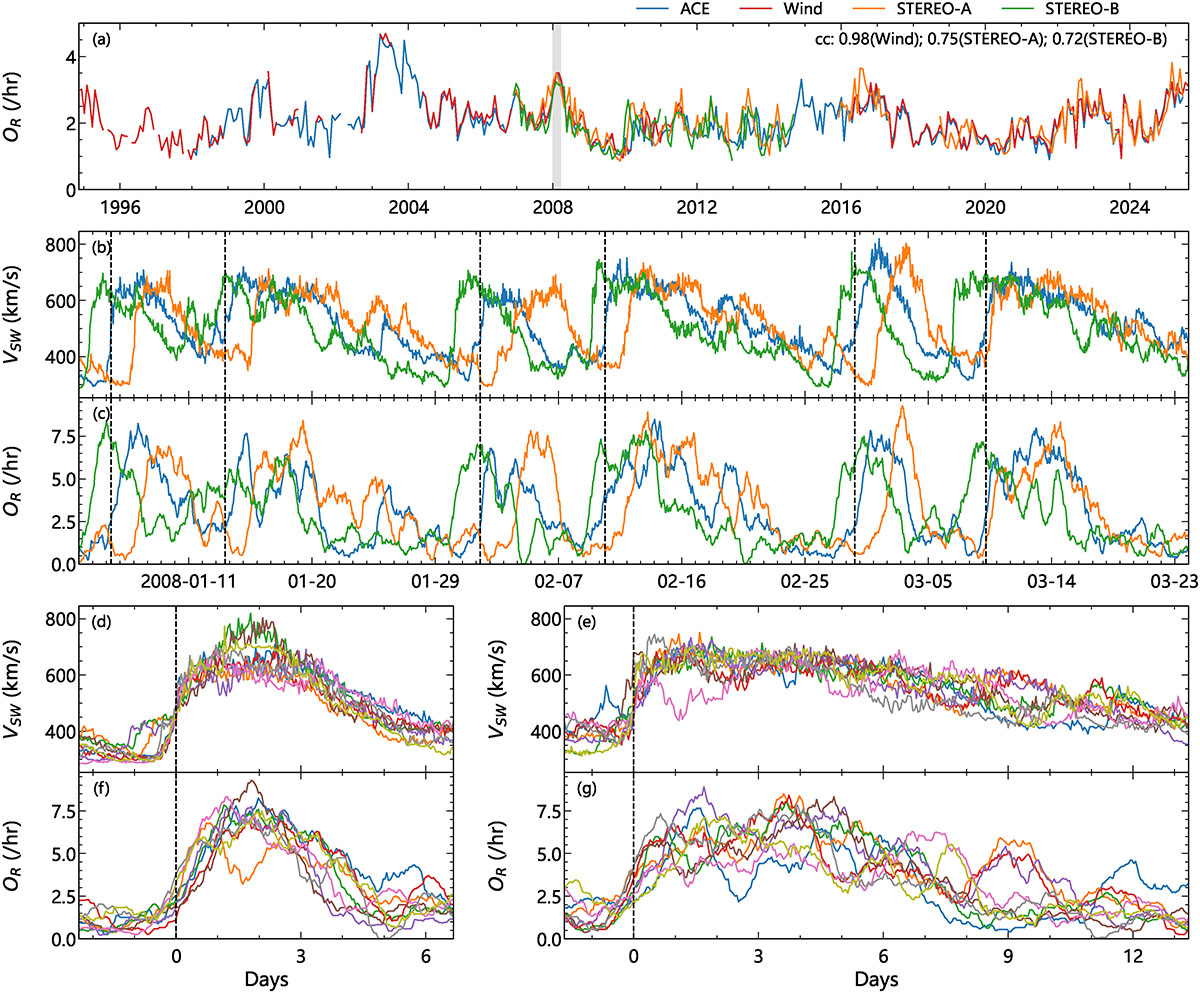
Fig. 4.
Download original image
Multi-spacecraft comparison at 1 au. Panel (a): Temporal variations of OR (using the same 27-day sliding window in Fig. 1) observed by ACE (blue), Wind (red), STEREO-A (orange), and STEREO-B (green). Panels (b)-(c): VSW and OR (using the same 2-day sliding window in Fig. 2) for the time intervals corresponding to the shaded regions in panel (a). The dashed black lines mark the onset times of the HSS observed by ACE, defined as the moments when VSW exceeds 500 km/s (accurate to the hour). Panels (d)-(g): Time-series superposition of the two sets of distinct 27-day repeating HSS intervals from (b)-(c), aligned at their respective onset times (t = 0).
Current usage metrics show cumulative count of Article Views (full-text article views including HTML views, PDF and ePub downloads, according to the available data) and Abstracts Views on Vision4Press platform.
Data correspond to usage on the plateform after 2015. The current usage metrics is available 48-96 hours after online publication and is updated daily on week days.
Initial download of the metrics may take a while.