Fig. 7
Download original image
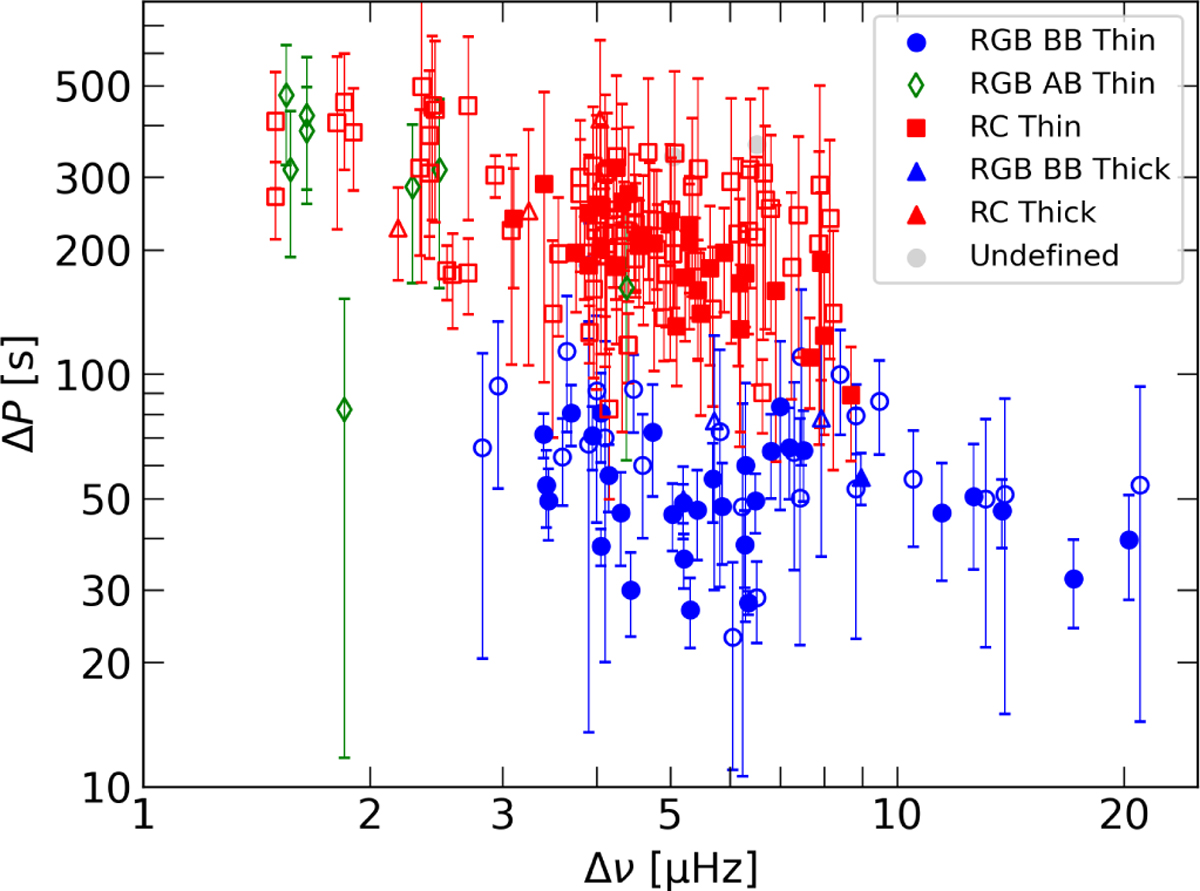
Relation of ΔP and Δv for the investigated stars. The blue symbols show giants below the RGB luminosity bump (BB), the green symbols are for giants above the bump (AB), and the red symbols are for red clump (RC) stars. The filled circles show stars for which the evolutionary stage was attributed with higher confidence. See the text for more explanations.
Current usage metrics show cumulative count of Article Views (full-text article views including HTML views, PDF and ePub downloads, according to the available data) and Abstracts Views on Vision4Press platform.
Data correspond to usage on the plateform after 2015. The current usage metrics is available 48-96 hours after online publication and is updated daily on week days.
Initial download of the metrics may take a while.