Fig. 1.
Download original image
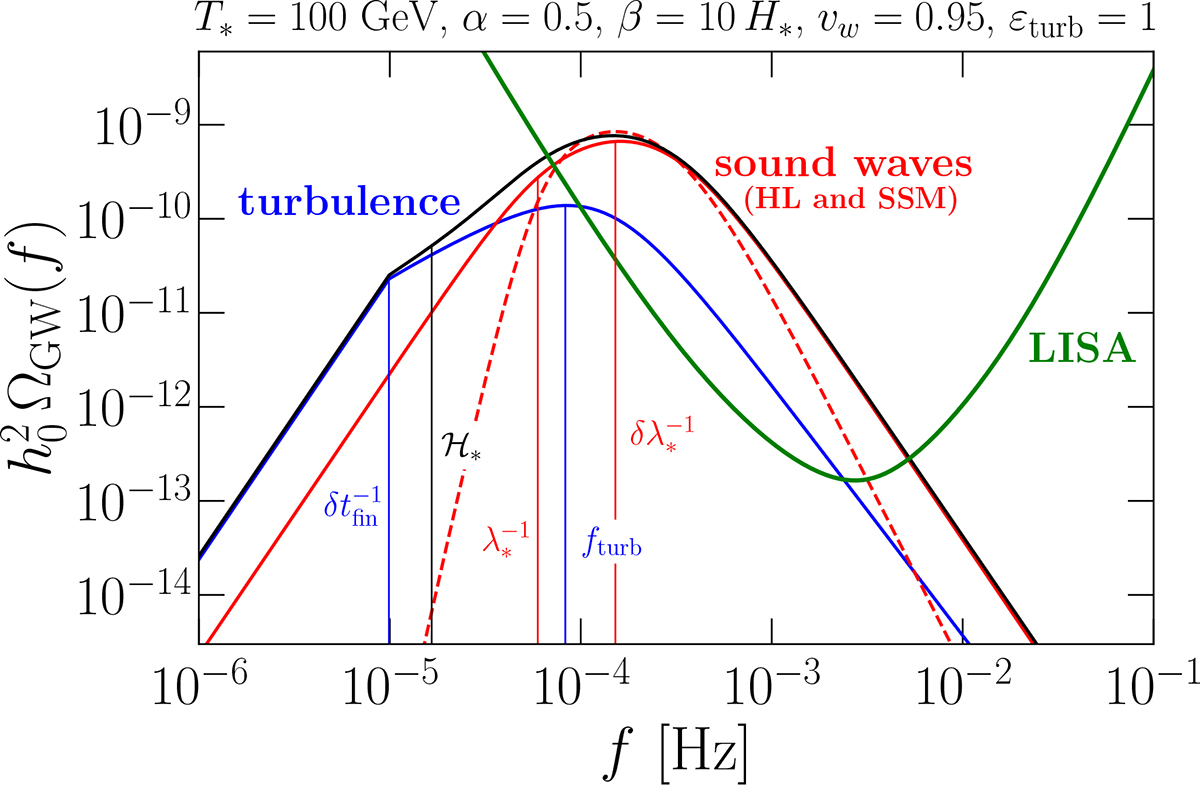
Spectra of the different components of the SGWB for T* = 100 GeV, α = 0.5, β = 10H*, vw = 0.95, and εturb = 1, compared to LISA’s power law sensitivity from Caprini et al. (2020) with an S/N threshold of 10. The SGWB spectra from sound waves are based on the SSM of Hindmarsh & Hijazi (2019, dashed red) and on the fit from HL simulations of Jinno et al. (2023) and Caprini et al. (2025, solid red). The spectrum of the turbulence is based on the model developed and numerically validated in Roper Pol et al. (2022a). The vertical lines indicate the relevant frequencies of the turbulence template (![]() and fturb) in blue, of the sound-wave template (λ*−1 and δλ*−1) in red, and the conformal Hubble frequency ℋ∗ at the time of GW generation in black.
and fturb) in blue, of the sound-wave template (λ*−1 and δλ*−1) in red, and the conformal Hubble frequency ℋ∗ at the time of GW generation in black.
Current usage metrics show cumulative count of Article Views (full-text article views including HTML views, PDF and ePub downloads, according to the available data) and Abstracts Views on Vision4Press platform.
Data correspond to usage on the plateform after 2015. The current usage metrics is available 48-96 hours after online publication and is updated daily on week days.
Initial download of the metrics may take a while.