Fig. 4
Download original image
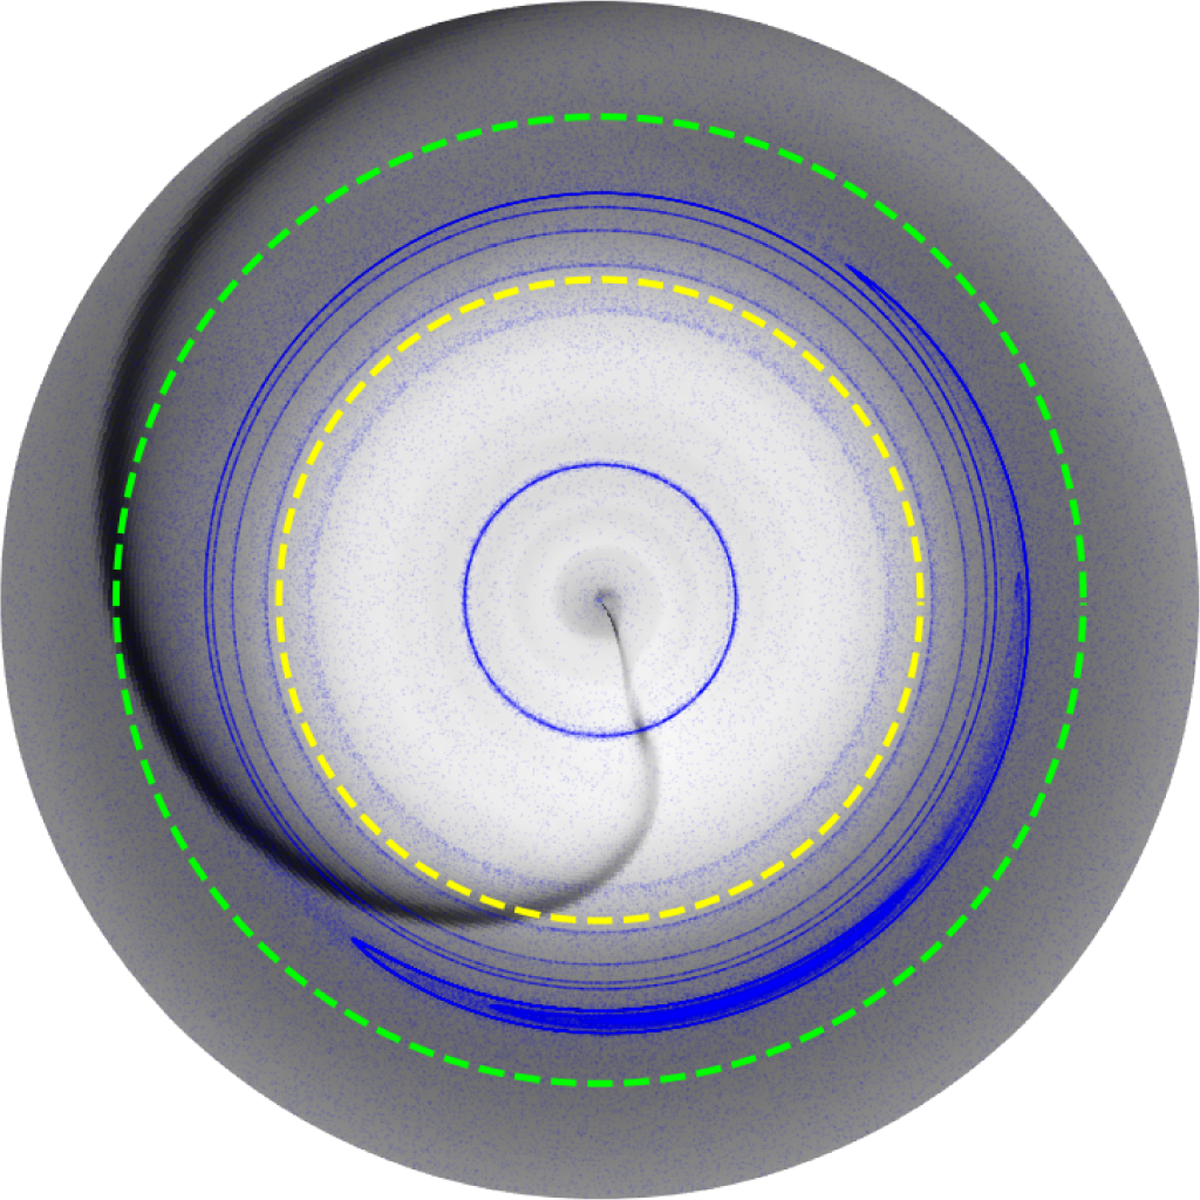
Gas and dust distributions for two widely separated Jupiter-mass planets. Blue dots represent 1.6-mm dust particles, superimposed on the perturbed gas surface density ΔΣ/Σ0 (color scale). Dashed green (yellow) lines indicate the 2:1 (3:2) mean motion resonance with the outer planet. The plot is zoomed in the region between 15 to 35 AU to better visualize the dust overdensity near the outer gap edge.
Current usage metrics show cumulative count of Article Views (full-text article views including HTML views, PDF and ePub downloads, according to the available data) and Abstracts Views on Vision4Press platform.
Data correspond to usage on the plateform after 2015. The current usage metrics is available 48-96 hours after online publication and is updated daily on week days.
Initial download of the metrics may take a while.