Open Access
Fig. A.1
Download original image
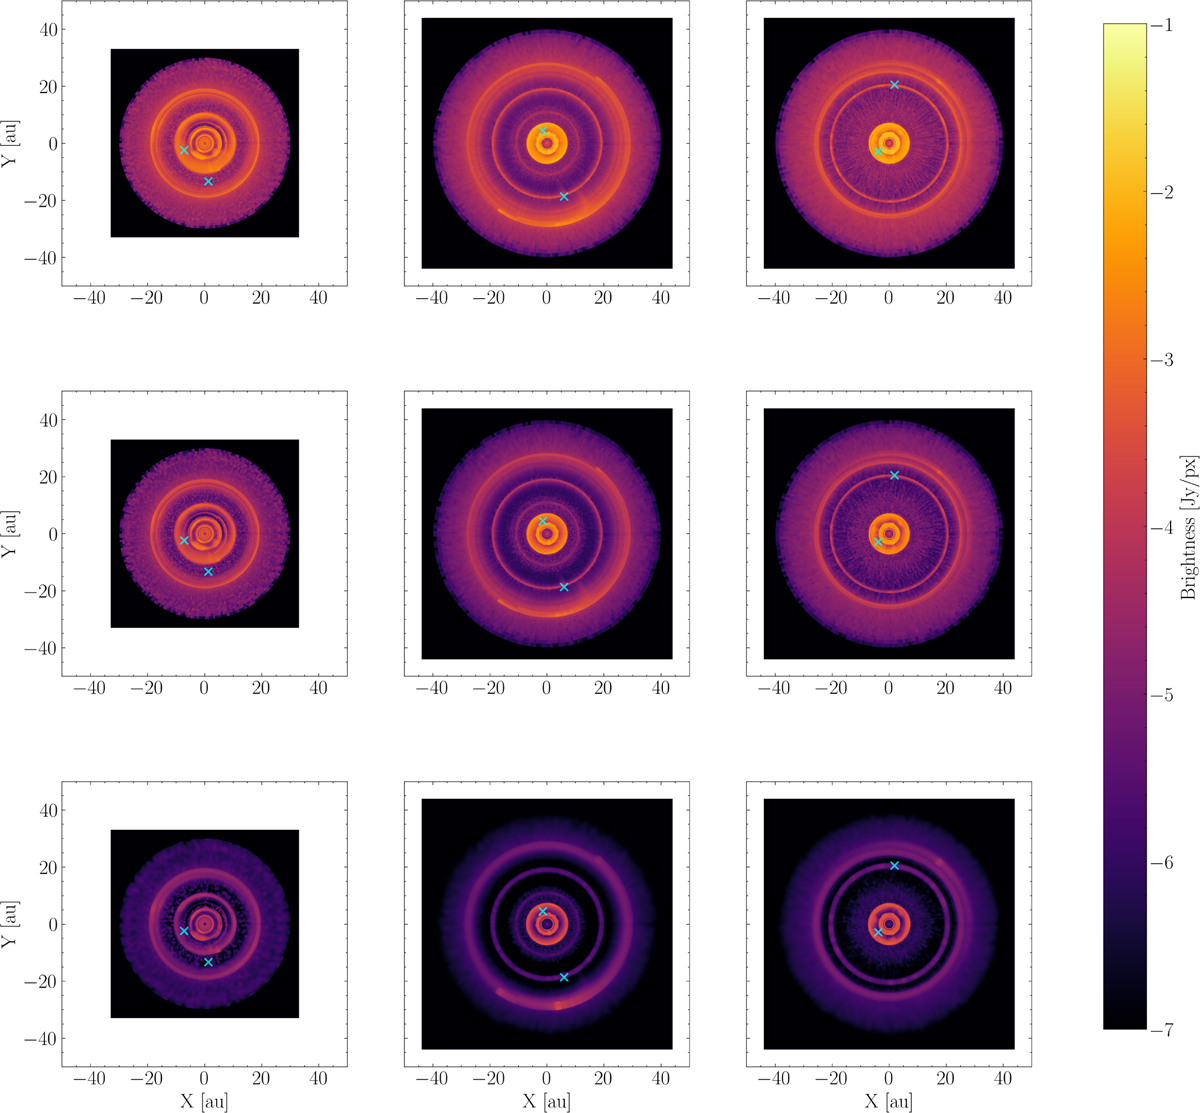
Continuum emission raw maps in Band 7 (top row), Band 6 (middle row) and Band 3 (bottom row), for the models with two Jupiter-mass planets in close orbits (left column), wide orbits (middle column) and for a Jupiter-Saturn pair (right column). Crosses indicate the position of the planets.
Current usage metrics show cumulative count of Article Views (full-text article views including HTML views, PDF and ePub downloads, according to the available data) and Abstracts Views on Vision4Press platform.
Data correspond to usage on the plateform after 2015. The current usage metrics is available 48-96 hours after online publication and is updated daily on week days.
Initial download of the metrics may take a while.