Open Access
Fig. 2
Download original image
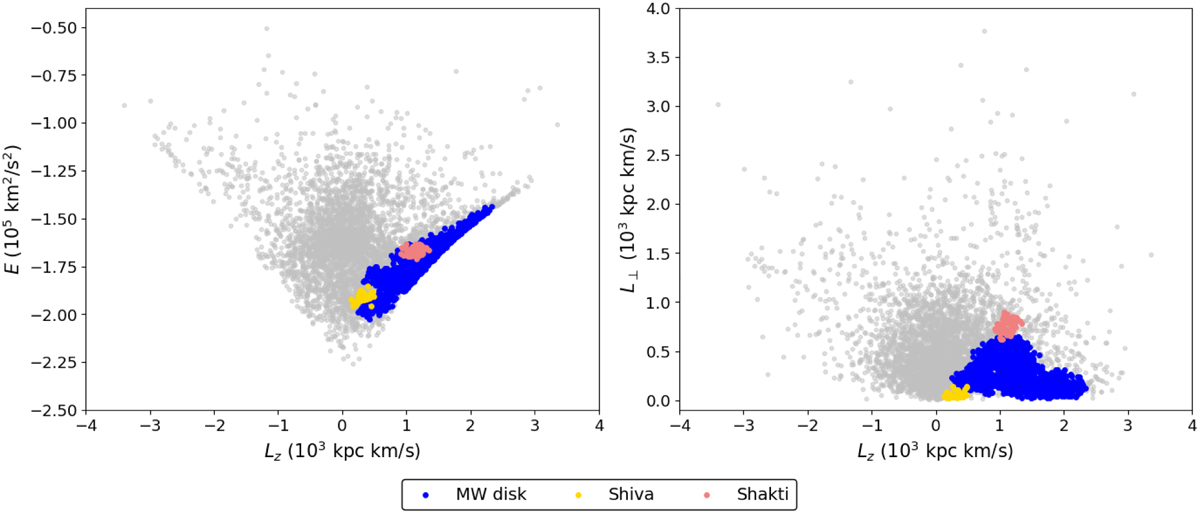
Distribution of 4933 RRLs from our sample in the E-Lz and Lz-L⊥ planes, colour-coded by the sub-structure to which they were assigned during the second phase of the CLiMB algorithm. Grey dots represent RRLs not assigned to any sub-structure.
Current usage metrics show cumulative count of Article Views (full-text article views including HTML views, PDF and ePub downloads, according to the available data) and Abstracts Views on Vision4Press platform.
Data correspond to usage on the plateform after 2015. The current usage metrics is available 48-96 hours after online publication and is updated daily on week days.
Initial download of the metrics may take a while.