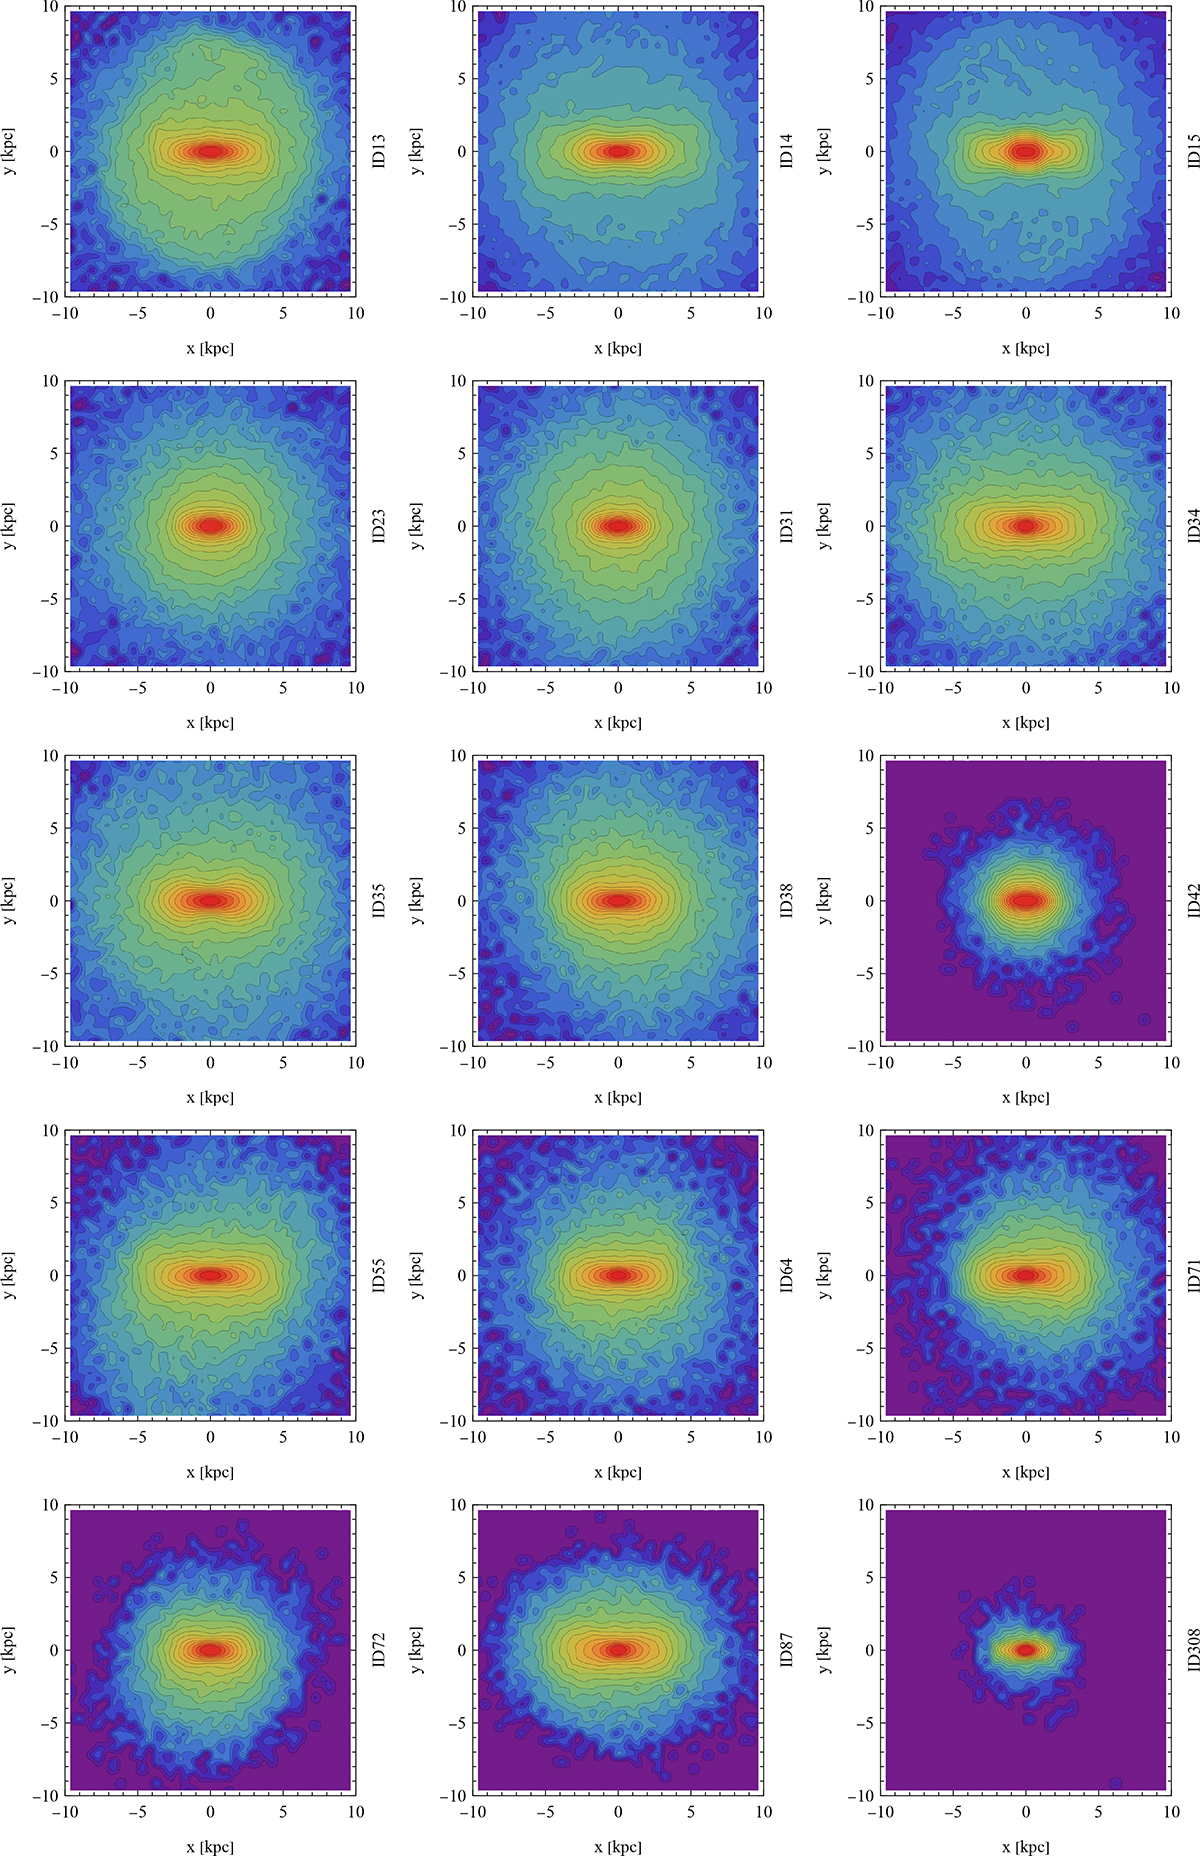
Fig. 1.
Download original image
Surface density maps of the stellar component of 15 bar-like galaxies in face-on view at z = 0. Galaxies are identified by their subhalo ID numbers at z = 0, shown on the right of each panel. The color scale is adjusted to the maximum and minimum density of each galaxy and the contours are equally spaced in log surface density.
Current usage metrics show cumulative count of Article Views (full-text article views including HTML views, PDF and ePub downloads, according to the available data) and Abstracts Views on Vision4Press platform.
Data correspond to usage on the plateform after 2015. The current usage metrics is available 48-96 hours after online publication and is updated daily on week days.
Initial download of the metrics may take a while.