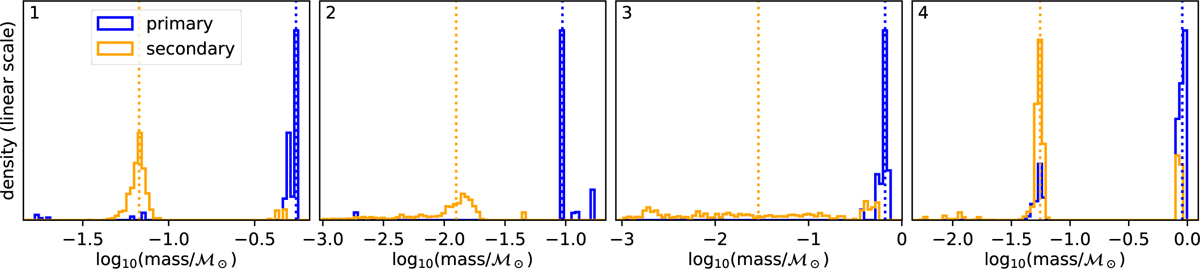
Fig. 11
Download original image
Examples of marginalised mass posteriors for the primary (blue) and secondary (orange) for four sources (one per panel). Panel 1 is typical, panels 2 and 3 show examples of long tails to low masses for the secondaries, and panel 4 shows where some of the MCMC chains moved between the primary and secondary during the sampling. The vertical dotted lines show the median masses.
Current usage metrics show cumulative count of Article Views (full-text article views including HTML views, PDF and ePub downloads, according to the available data) and Abstracts Views on Vision4Press platform.
Data correspond to usage on the plateform after 2015. The current usage metrics is available 48-96 hours after online publication and is updated daily on week days.
Initial download of the metrics may take a while.