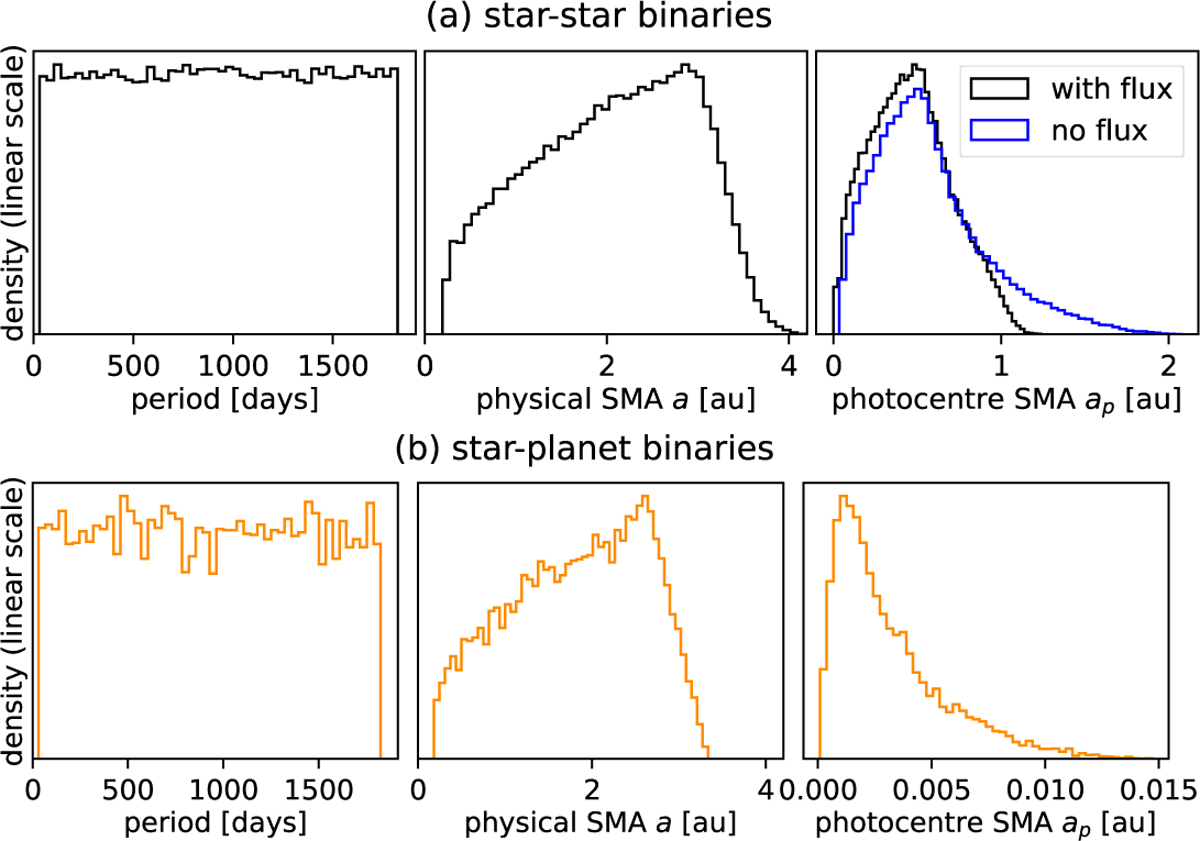
Fig. B.2
Download original image
Distribution of the period and SMAs in the simulated star-star systems (top), and the simulated star-planet systems (bottom).The two left panels span a common range, as do the two centre ones, but the right ones do not. The blue curve in the upper right panel shows the distribution if we erroneously neglect the flux from the secondary in computing the photocentre of the SMA.
Current usage metrics show cumulative count of Article Views (full-text article views including HTML views, PDF and ePub downloads, according to the available data) and Abstracts Views on Vision4Press platform.
Data correspond to usage on the plateform after 2015. The current usage metrics is available 48-96 hours after online publication and is updated daily on week days.
Initial download of the metrics may take a while.