Fig. B.3
Download original image
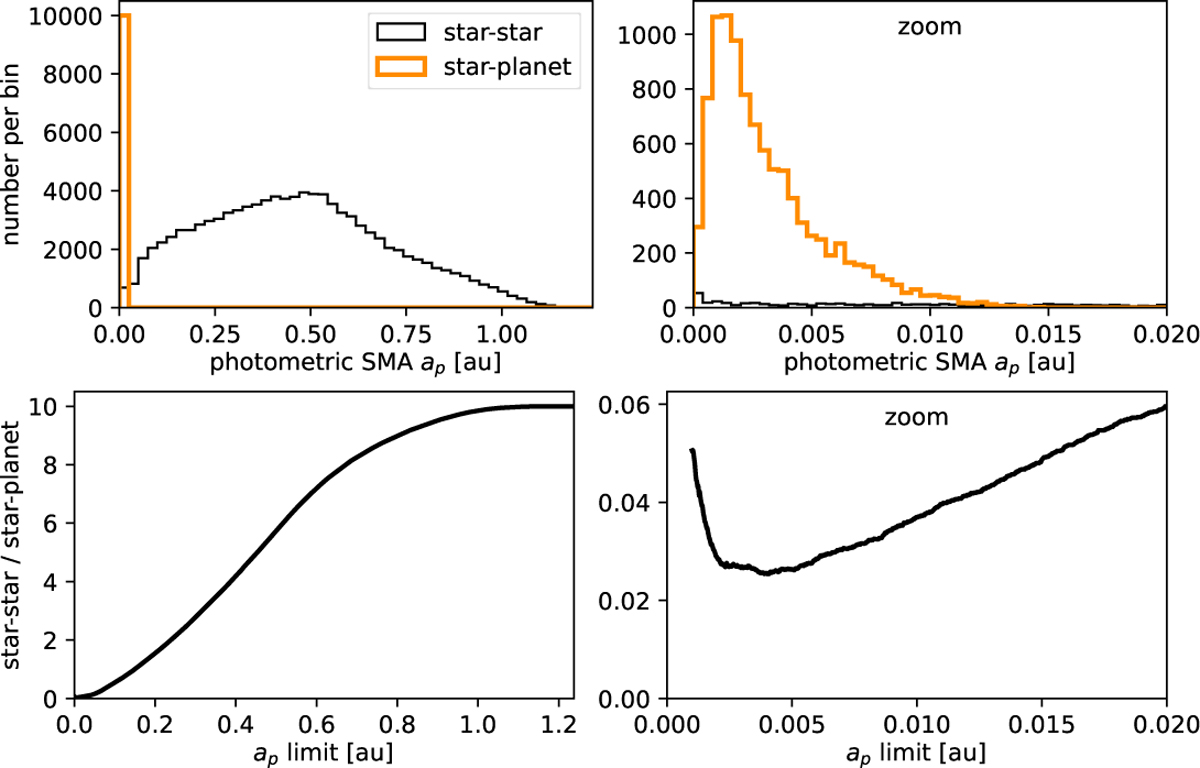
Comparison of the photometric SMA distributions for the simulated star-star and star-planet systems. The right panel is a zoom of the left panel in both rows. The top row shows the actual number of systems per bin (taking into account that star-planet binaries are ten times rarer). The bottom row shows the ratio of the number of star-star to star-planet systems that have a photometric SMA less than the value shown on the horizontal axis.
Current usage metrics show cumulative count of Article Views (full-text article views including HTML views, PDF and ePub downloads, according to the available data) and Abstracts Views on Vision4Press platform.
Data correspond to usage on the plateform after 2015. The current usage metrics is available 48-96 hours after online publication and is updated daily on week days.
Initial download of the metrics may take a while.