Fig. 7
Download original image
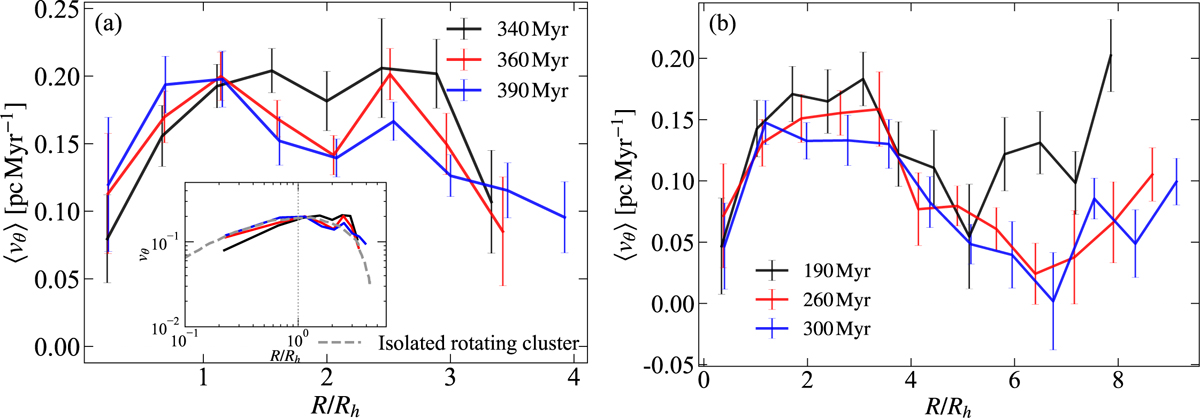
Rotation curves of the merger remnants for models M1ρ0.25 (p10; panel a) and M4ρ4 (p5; panel b) at different evolutionary times, as indicated. The inset shows, in logarithmic scales, a representative rotation curve of an isolated rotating cluster taken from Kim et al. (2004), illustrating the rapid decline of the rotational velocity beyond Rh.
Current usage metrics show cumulative count of Article Views (full-text article views including HTML views, PDF and ePub downloads, according to the available data) and Abstracts Views on Vision4Press platform.
Data correspond to usage on the plateform after 2015. The current usage metrics is available 48-96 hours after online publication and is updated daily on week days.
Initial download of the metrics may take a while.