Fig. 1.
Download original image
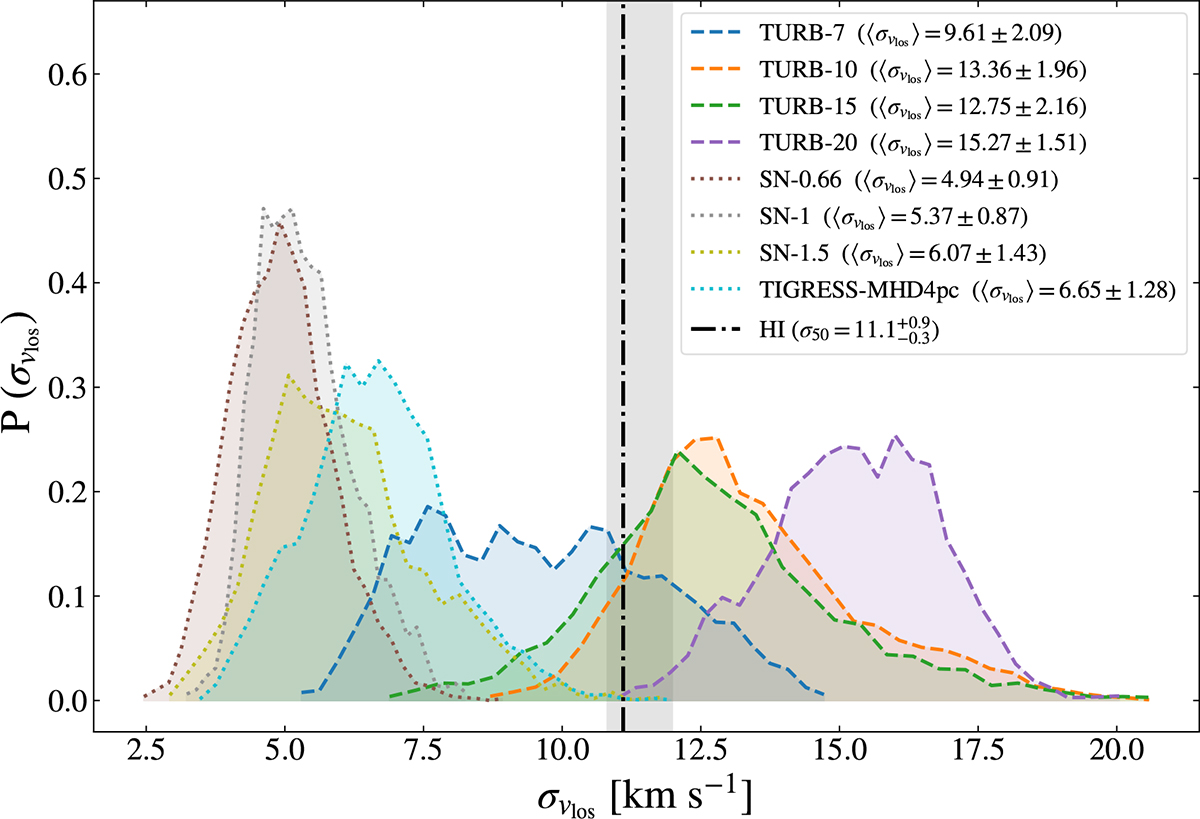
Probability density functions of mass-weighted LOS velocity dispersions for all simulations. Each curve shows the distribution of dispersion values obtained from the different masked sky maps for a given simulation. Dashed curves correspond to the large-scale–forced TURB runs, while dotted curves denote the SN-driven simulations (SN series and TIGRESS-MHD4pc). The dot-dashed vertical line marks the median H I velocity dispersion, ![]() , derived from the Monte Carlo sampling of the LOS velocities reported by S25 using the Reid et al. (2019) Galactic rotation model parameters in a volume spanning 70–500 pc around the Sun. The gray shaded vertical band represents the corresponding 25th–75th percentile range. Velocity dispersions were computed after applying a velocity threshold of |vlos| ≤ 30 km s−1.
, derived from the Monte Carlo sampling of the LOS velocities reported by S25 using the Reid et al. (2019) Galactic rotation model parameters in a volume spanning 70–500 pc around the Sun. The gray shaded vertical band represents the corresponding 25th–75th percentile range. Velocity dispersions were computed after applying a velocity threshold of |vlos| ≤ 30 km s−1.
Current usage metrics show cumulative count of Article Views (full-text article views including HTML views, PDF and ePub downloads, according to the available data) and Abstracts Views on Vision4Press platform.
Data correspond to usage on the plateform after 2015. The current usage metrics is available 48-96 hours after online publication and is updated daily on week days.
Initial download of the metrics may take a while.