Fig. C.1.
Download original image
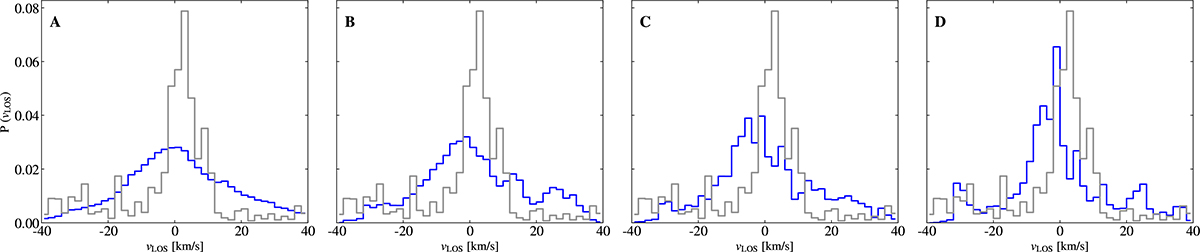
Evolution of the velocity PDF as successive numerical processing steps are applied to one TURB-15 map. The gray histogram shows the H I PDF from S25 (70–500 pc, |vlos| ≤ 40 km s−1). Blue histograms correspond to (A) the intrinsic full-resolution 3D simulation, (B) the 2D (x,y) map obtained by averaging along z, (C) the synthetic sky projection (4 pc radial, 10° angular sampling), and (D) the same projection after applying one observational mask.
Current usage metrics show cumulative count of Article Views (full-text article views including HTML views, PDF and ePub downloads, according to the available data) and Abstracts Views on Vision4Press platform.
Data correspond to usage on the plateform after 2015. The current usage metrics is available 48-96 hours after online publication and is updated daily on week days.
Initial download of the metrics may take a while.