Fig. 8
Download original image
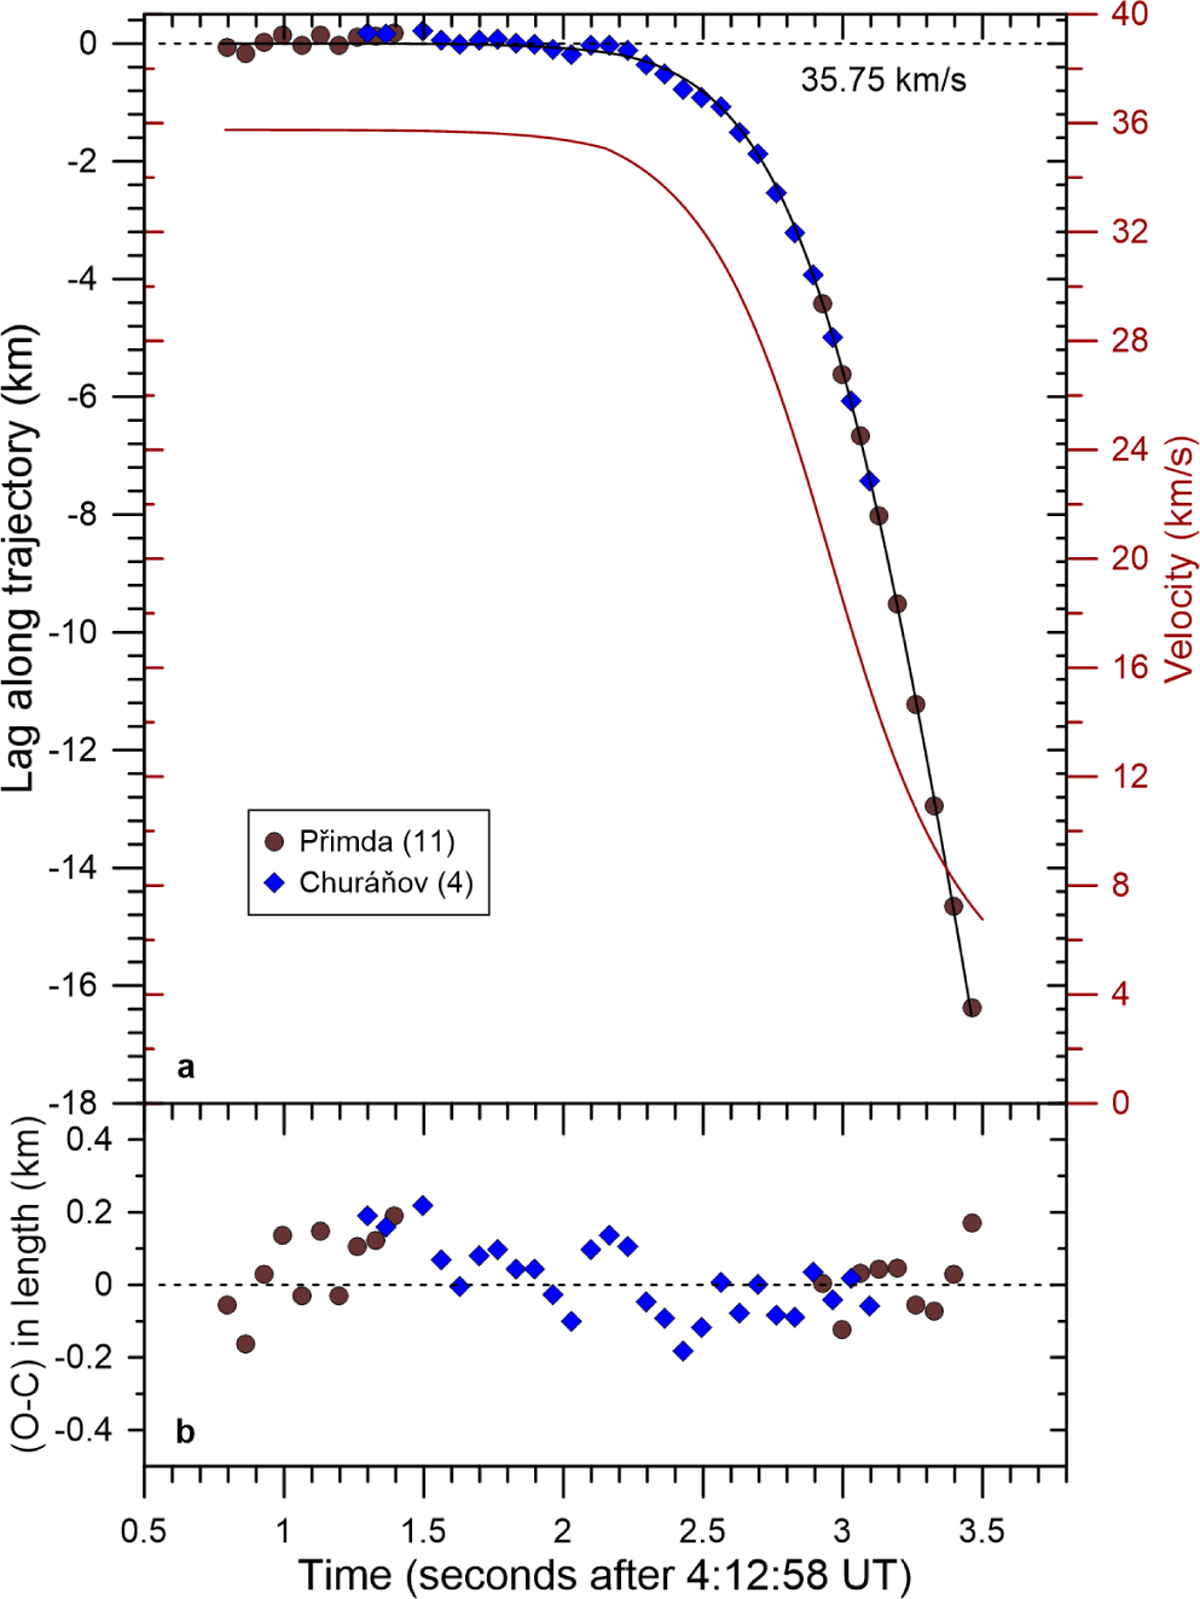
Dynamics of fireball. The upper panel, a, shows the observed (symbols) and fit (black line) lag in the length along the trajectory in respect to a hypothetical body with constant velocity of 35.75 km s−1. The red line with scale on the right shows the velocity derived from the fit. The lower panel, b, shows the residuals of the observed points relative to the fit.
Current usage metrics show cumulative count of Article Views (full-text article views including HTML views, PDF and ePub downloads, according to the available data) and Abstracts Views on Vision4Press platform.
Data correspond to usage on the plateform after 2015. The current usage metrics is available 48-96 hours after online publication and is updated daily on week days.
Initial download of the metrics may take a while.