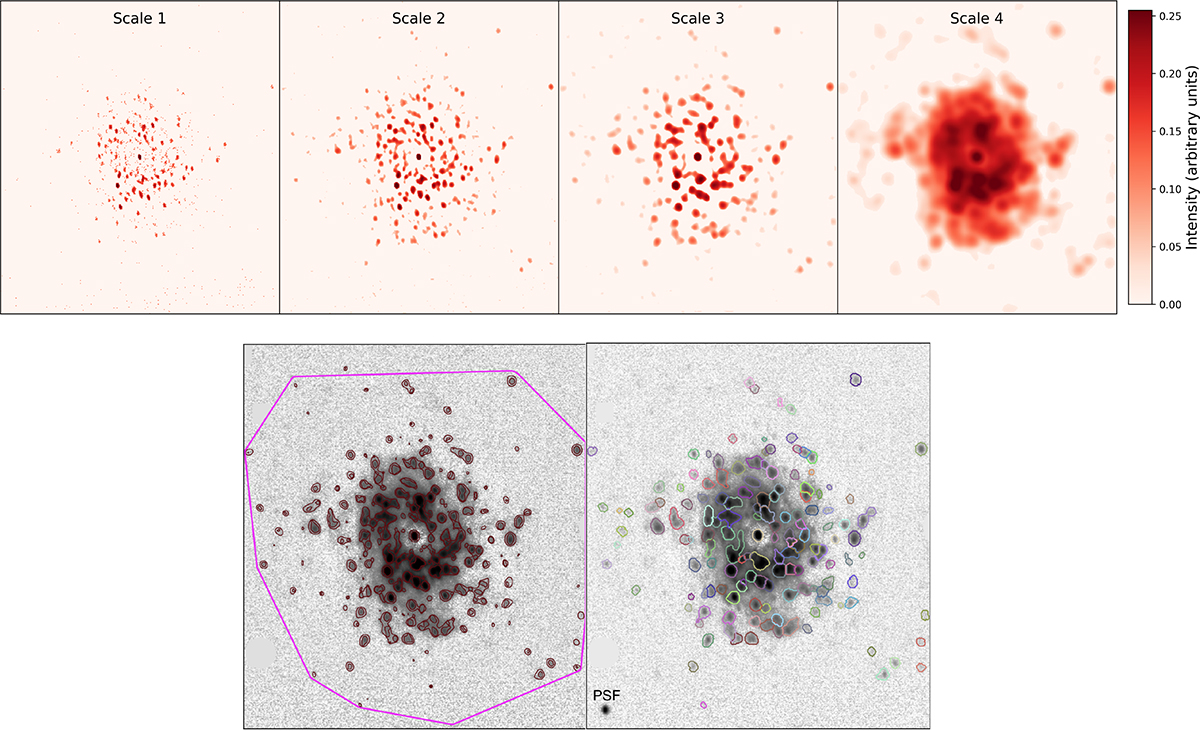
Fig. 2.
Download original image
Illustration of the analysis pipeline for galaxy VFID 1035 (NGC 3982). Top: Decomposition of the Hα image into four Scarlet scales. In the bottom panels, the Hα image is shown in grayscale (in arcsinh scaling). Bottom-left: Scarlet clump mask in burgundy contours, set to the 99.7th percentile of (∼3σ above) the noise. Given the seeing FWHM of 1.39″, this mask consists of both Scarlet scale two and three, visible as small contours within slightly larger contours. The galaxy boundary from the fourth Scarlet scale is marked in the fuchsia curve. Bottom-right: Final clump map after source detection and de-blending by Photutils. Bottom-left corner: Image PSF for size comparison; here, 95% of the clumps are larger than the PSF. See the main text for an extensive description of our analysis pipeline.
Current usage metrics show cumulative count of Article Views (full-text article views including HTML views, PDF and ePub downloads, according to the available data) and Abstracts Views on Vision4Press platform.
Data correspond to usage on the plateform after 2015. The current usage metrics is available 48-96 hours after online publication and is updated daily on week days.
Initial download of the metrics may take a while.