Fig. 3.
Download original image
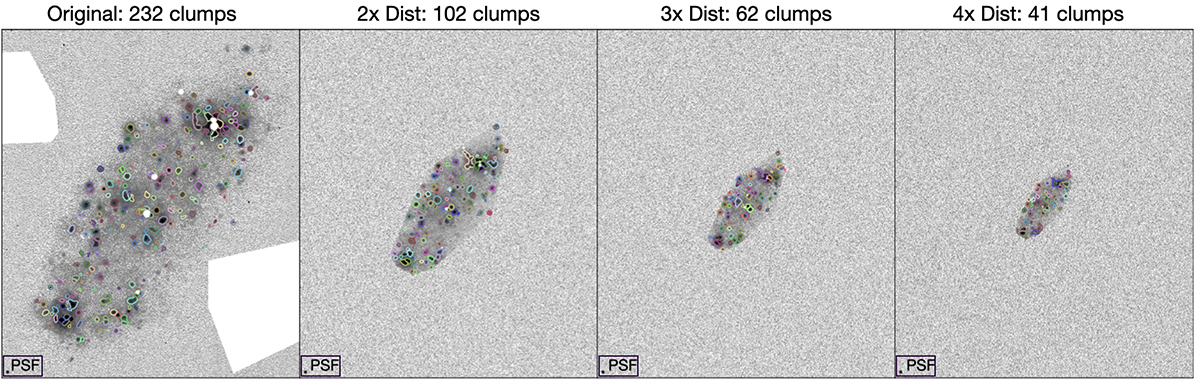
Clumps detected by our analysis pipeline (coloured circles) in SINGS galaxy NGC 2976 at its original distance (first panel), with the galaxy artificially moved to twice (second panel), then thrice (third panel), and, finally, four times the distance (last panel; see text for details). We can see that while the clumps are always placed in the same general regions of the galaxy, the number of clumps decreases strongly with the distance.
Current usage metrics show cumulative count of Article Views (full-text article views including HTML views, PDF and ePub downloads, according to the available data) and Abstracts Views on Vision4Press platform.
Data correspond to usage on the plateform after 2015. The current usage metrics is available 48-96 hours after online publication and is updated daily on week days.
Initial download of the metrics may take a while.