Fig. 7.
Download original image
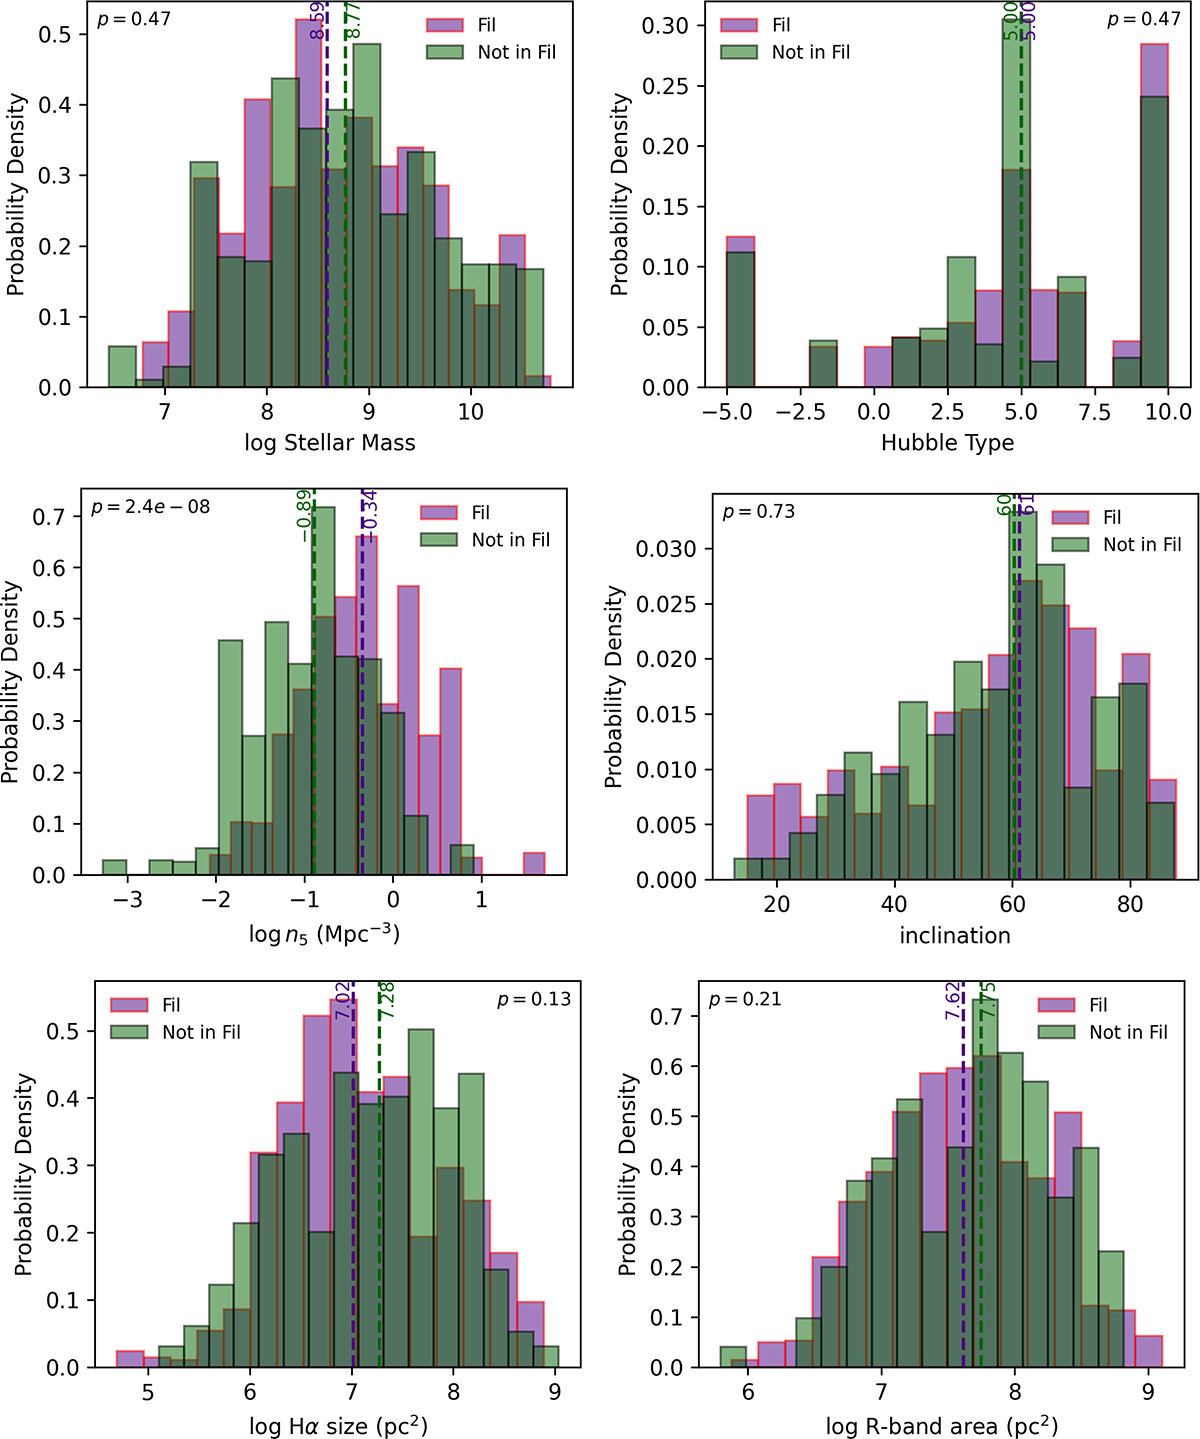
Comparison of the distribution of various quantities for (PSF-matched) filament (purple) vs non-filament (green) galaxies in our sample (not mass-complete). We show the stellar mass (top-left), Hubble type (top-right), local density n5 (middle-left), inclination (middle-right; 90° refers to edge-on), Hα size (bottom-left), and r-band size (bottom-right). The median values of each distribution are marked as vertical dashed lines (purple for filament and green for non-filament). Our filament galaxies have much higher local densities and possibly smaller sizes than non-filament galaxies, but are otherwise relatively similar in terms of physical properties.
Current usage metrics show cumulative count of Article Views (full-text article views including HTML views, PDF and ePub downloads, according to the available data) and Abstracts Views on Vision4Press platform.
Data correspond to usage on the plateform after 2015. The current usage metrics is available 48-96 hours after online publication and is updated daily on week days.
Initial download of the metrics may take a while.