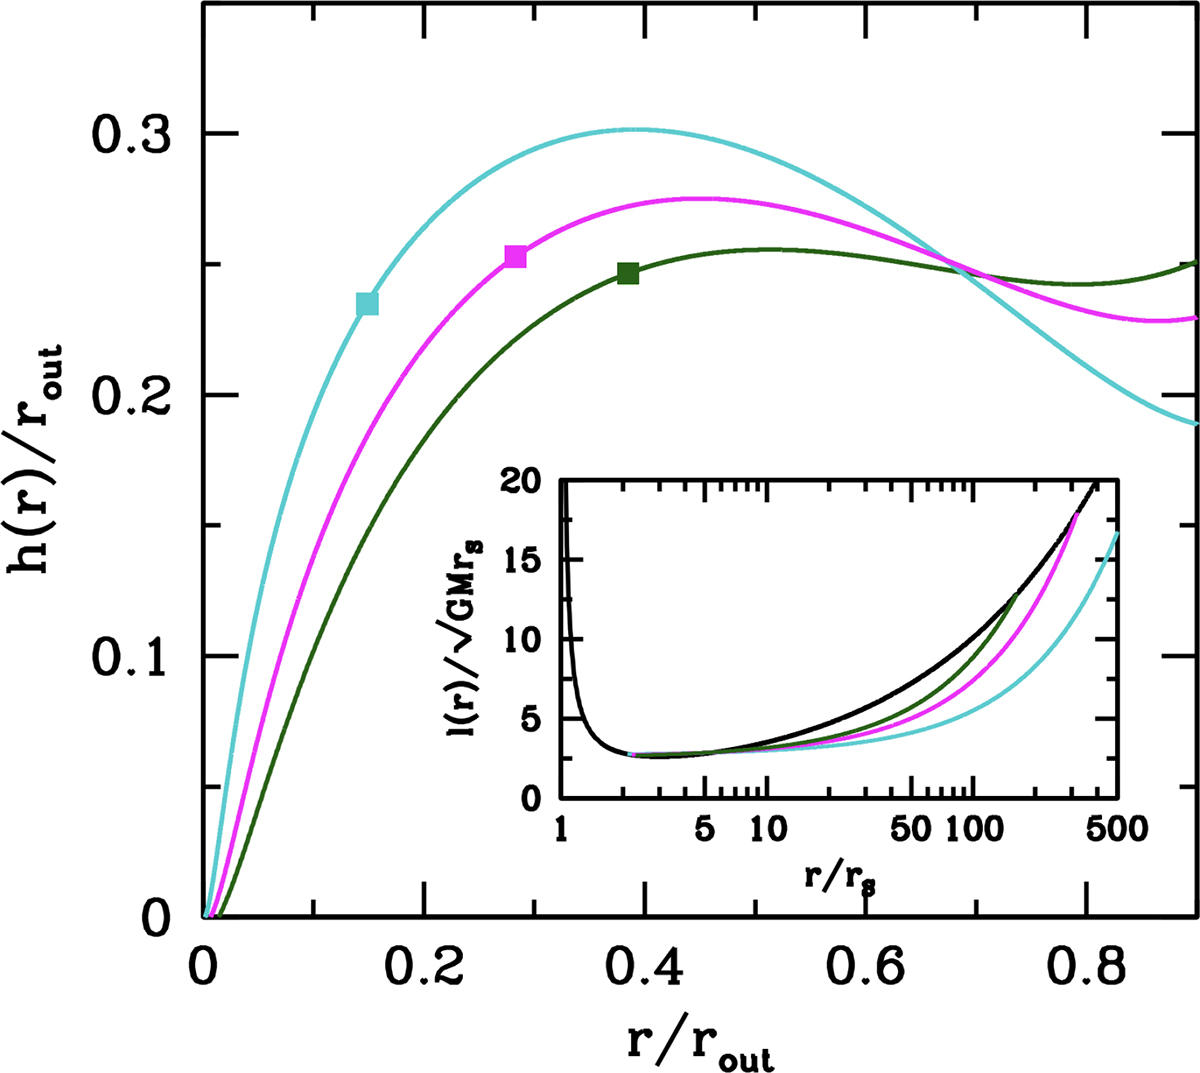
Fig. 1.
Download original image
Meridional cross sections (over one quadrant) for the supercritical thick disks described by Models A (cyan curve), B (magenta curve), and C (green curve). As rin decreases, rout increases and so does the ratio Lrad/LEdd, while the efficiency of mass to energy conversion becomes progressively smaller. Smaller values of rin also imply steeper and deeper funnels, where pressure gradients are balanced by centrifugal forces rather than by gravity and luminosities can exceed the Eddington limit. The square symbols mark the location on the surface inside which 90% of the disk luminosity Lrad is actually emitted. The inset shows the Keplerian specific angular momentum distribution for the adopted pseudo-Newtonian potential (black line) and the three angular momentum distributions corresponding to our supercritical disks (Models A, B, and C).
Current usage metrics show cumulative count of Article Views (full-text article views including HTML views, PDF and ePub downloads, according to the available data) and Abstracts Views on Vision4Press platform.
Data correspond to usage on the plateform after 2015. The current usage metrics is available 48-96 hours after online publication and is updated daily on week days.
Initial download of the metrics may take a while.