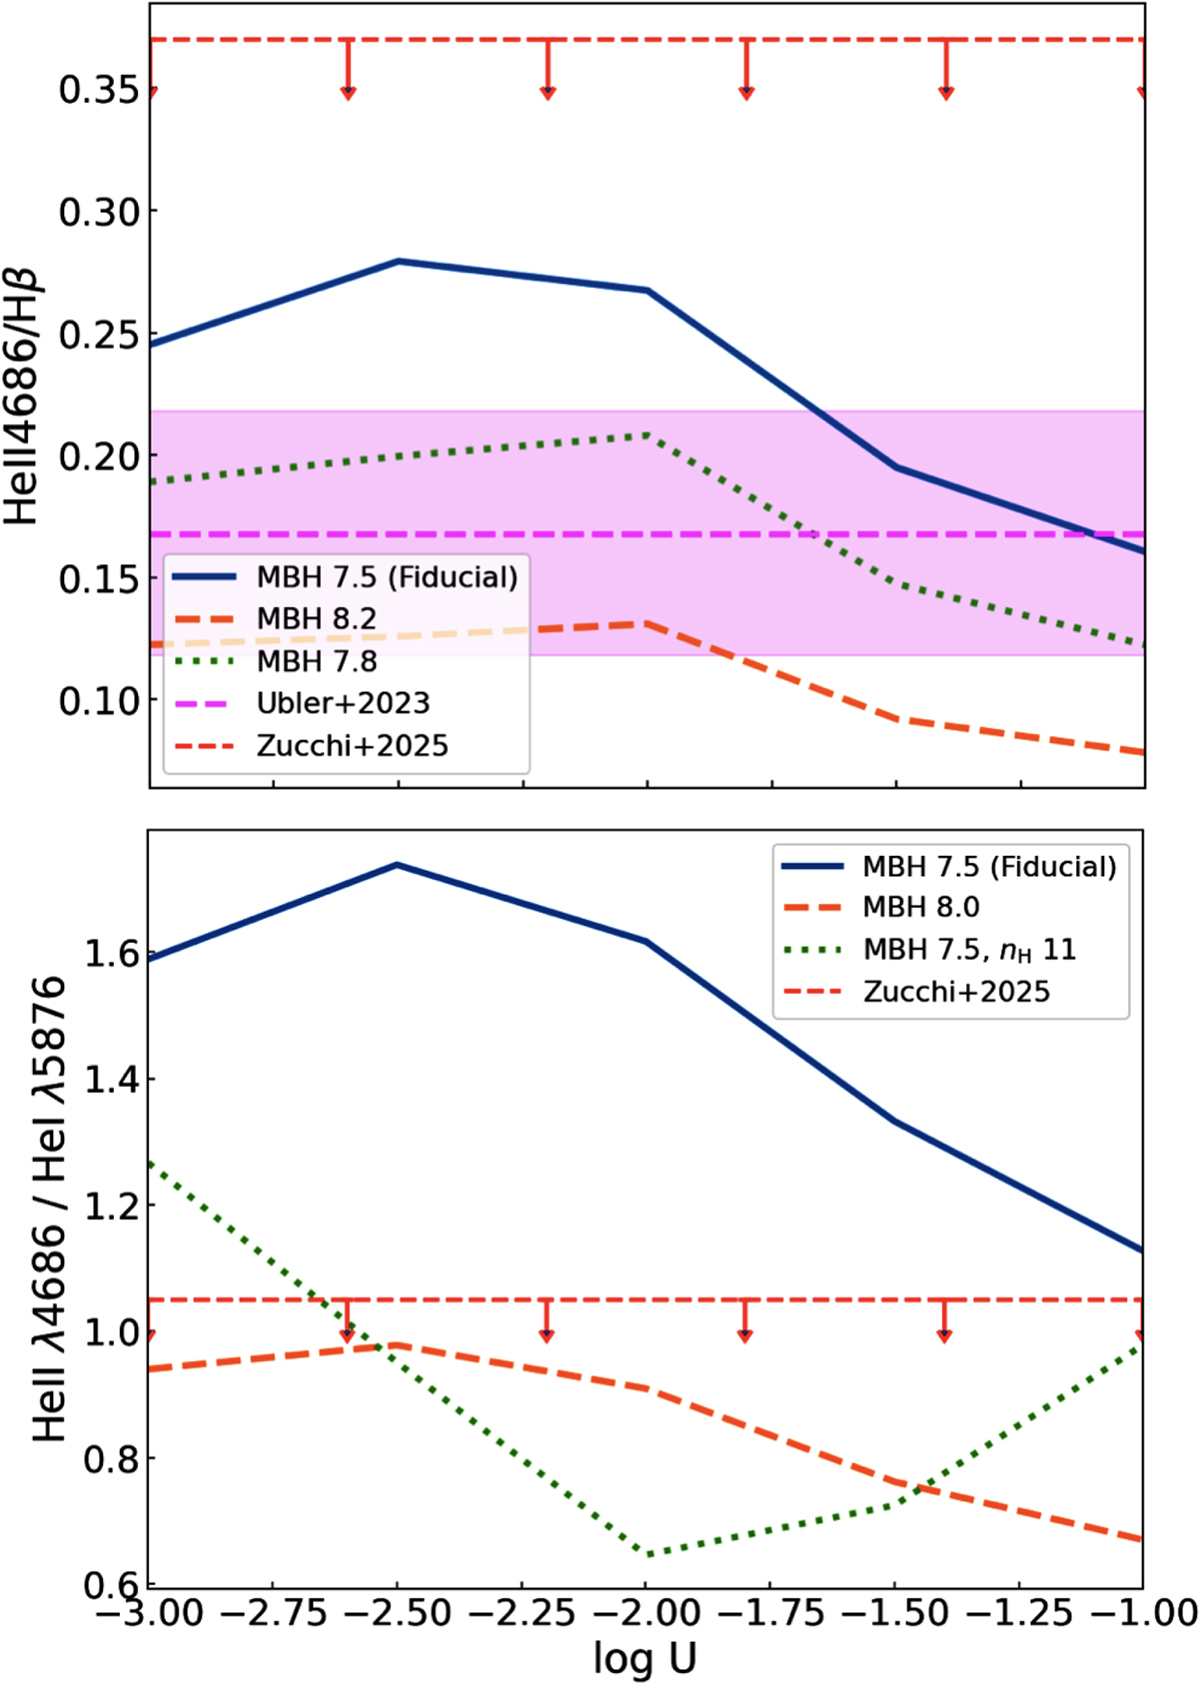
Fig. 8.
Download original image
Predicted broad-line ratios as a function of ionization parameter, log U, from our CLOUDY grid. The curves illustrate the sensitivity of these diagnostics to the hardness of the incident continuum, which becomes softer for larger black-hole masses, and to the gas density. All calculations adopt the same BLR gas parameters as in Figure 6 (metallicity 0.1 Z⊙, density log(nH/cm−3) = 10, and total hydrogen column log(NH/cm−2) = 23). Top panel: He IIλ4686/Hβ. The solid, dotted, and dashed curves correspond to models with log(MBH/M⊙) = 7.5 (fiducial), 7.8, and 8.2, respectively. For comparison, the dashed magenta line and shaded magenta band show the value reported by Übler et al. (2023) for the z = 5.55 AGN GS_3073 (which has an estimated black-hole mass of log(MBH/M⊙) = 8.2 ± 0.4), while the dashed red line indicates the upper limit from the stack of LBDs (Zucchi et al. 2026) (downward arrows). Bottom panel: He IIλ4686/He Iλ5876. The solid, dotted, and dashed curves correspond to models with (nH, MBH) = (1010 cm−3, 107.5 M⊙),(1010 cm−3, 108 M⊙), and (1011 cm−3, 107.5 M⊙), respectively.
Current usage metrics show cumulative count of Article Views (full-text article views including HTML views, PDF and ePub downloads, according to the available data) and Abstracts Views on Vision4Press platform.
Data correspond to usage on the plateform after 2015. The current usage metrics is available 48-96 hours after online publication and is updated daily on week days.
Initial download of the metrics may take a while.