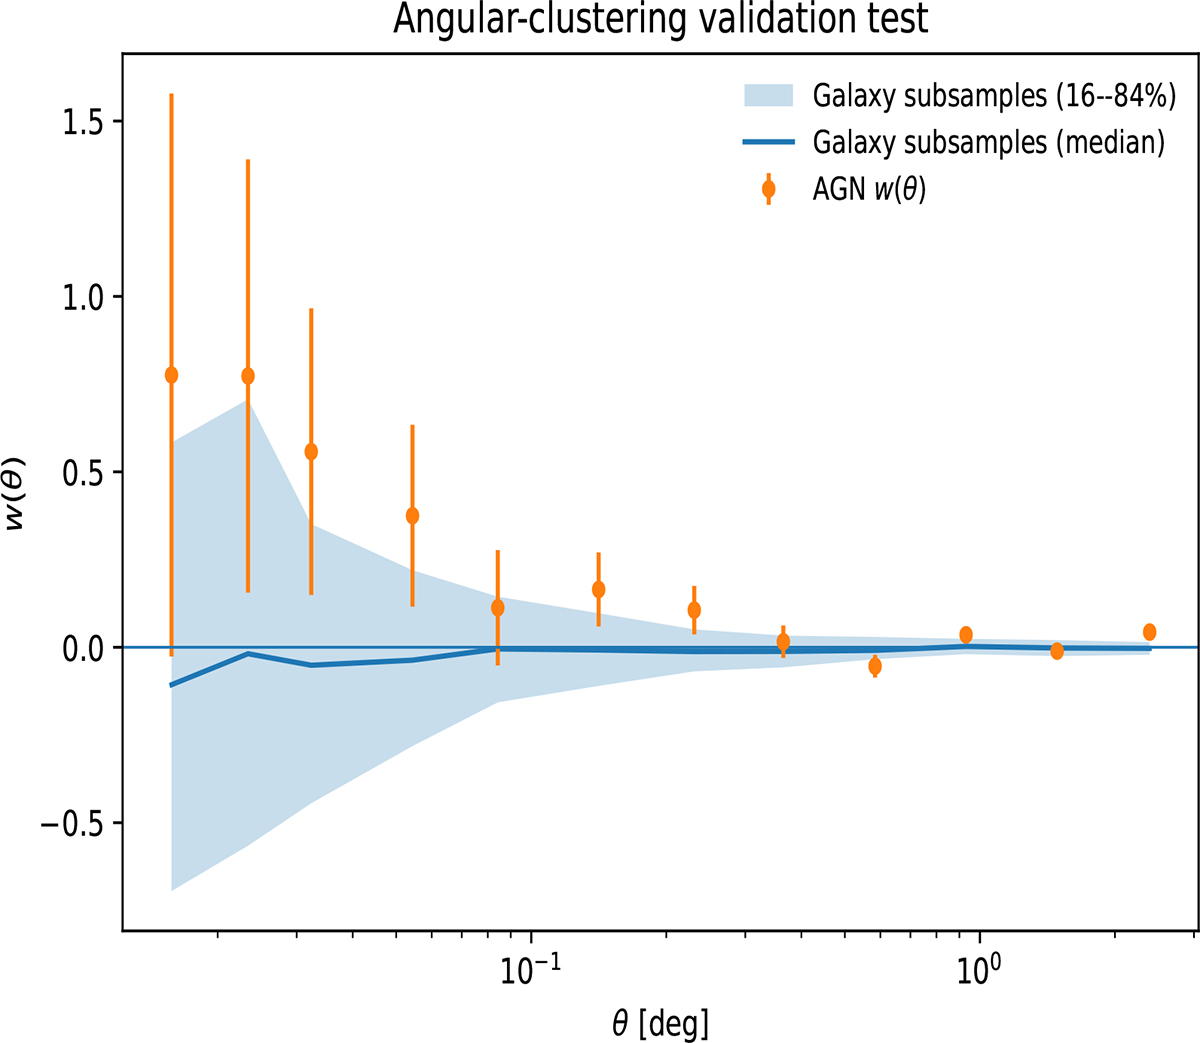
Fig. A.1.
Download original image
Angular correlation functions. Comparison between the AGN angular correlation function, wAGN(θ), and the distribution of w(θ) measured from random galaxy subsamples of equal size and matched redshift distribution. The shaded region shows the 16–84 per cent range and the solid line the median of the galaxy subsamples. The AGN measurements are consistent with this distribution on the angular scales relevant for the clustering analysis.
Current usage metrics show cumulative count of Article Views (full-text article views including HTML views, PDF and ePub downloads, according to the available data) and Abstracts Views on Vision4Press platform.
Data correspond to usage on the plateform after 2015. The current usage metrics is available 48-96 hours after online publication and is updated daily on week days.
Initial download of the metrics may take a while.