Open Access
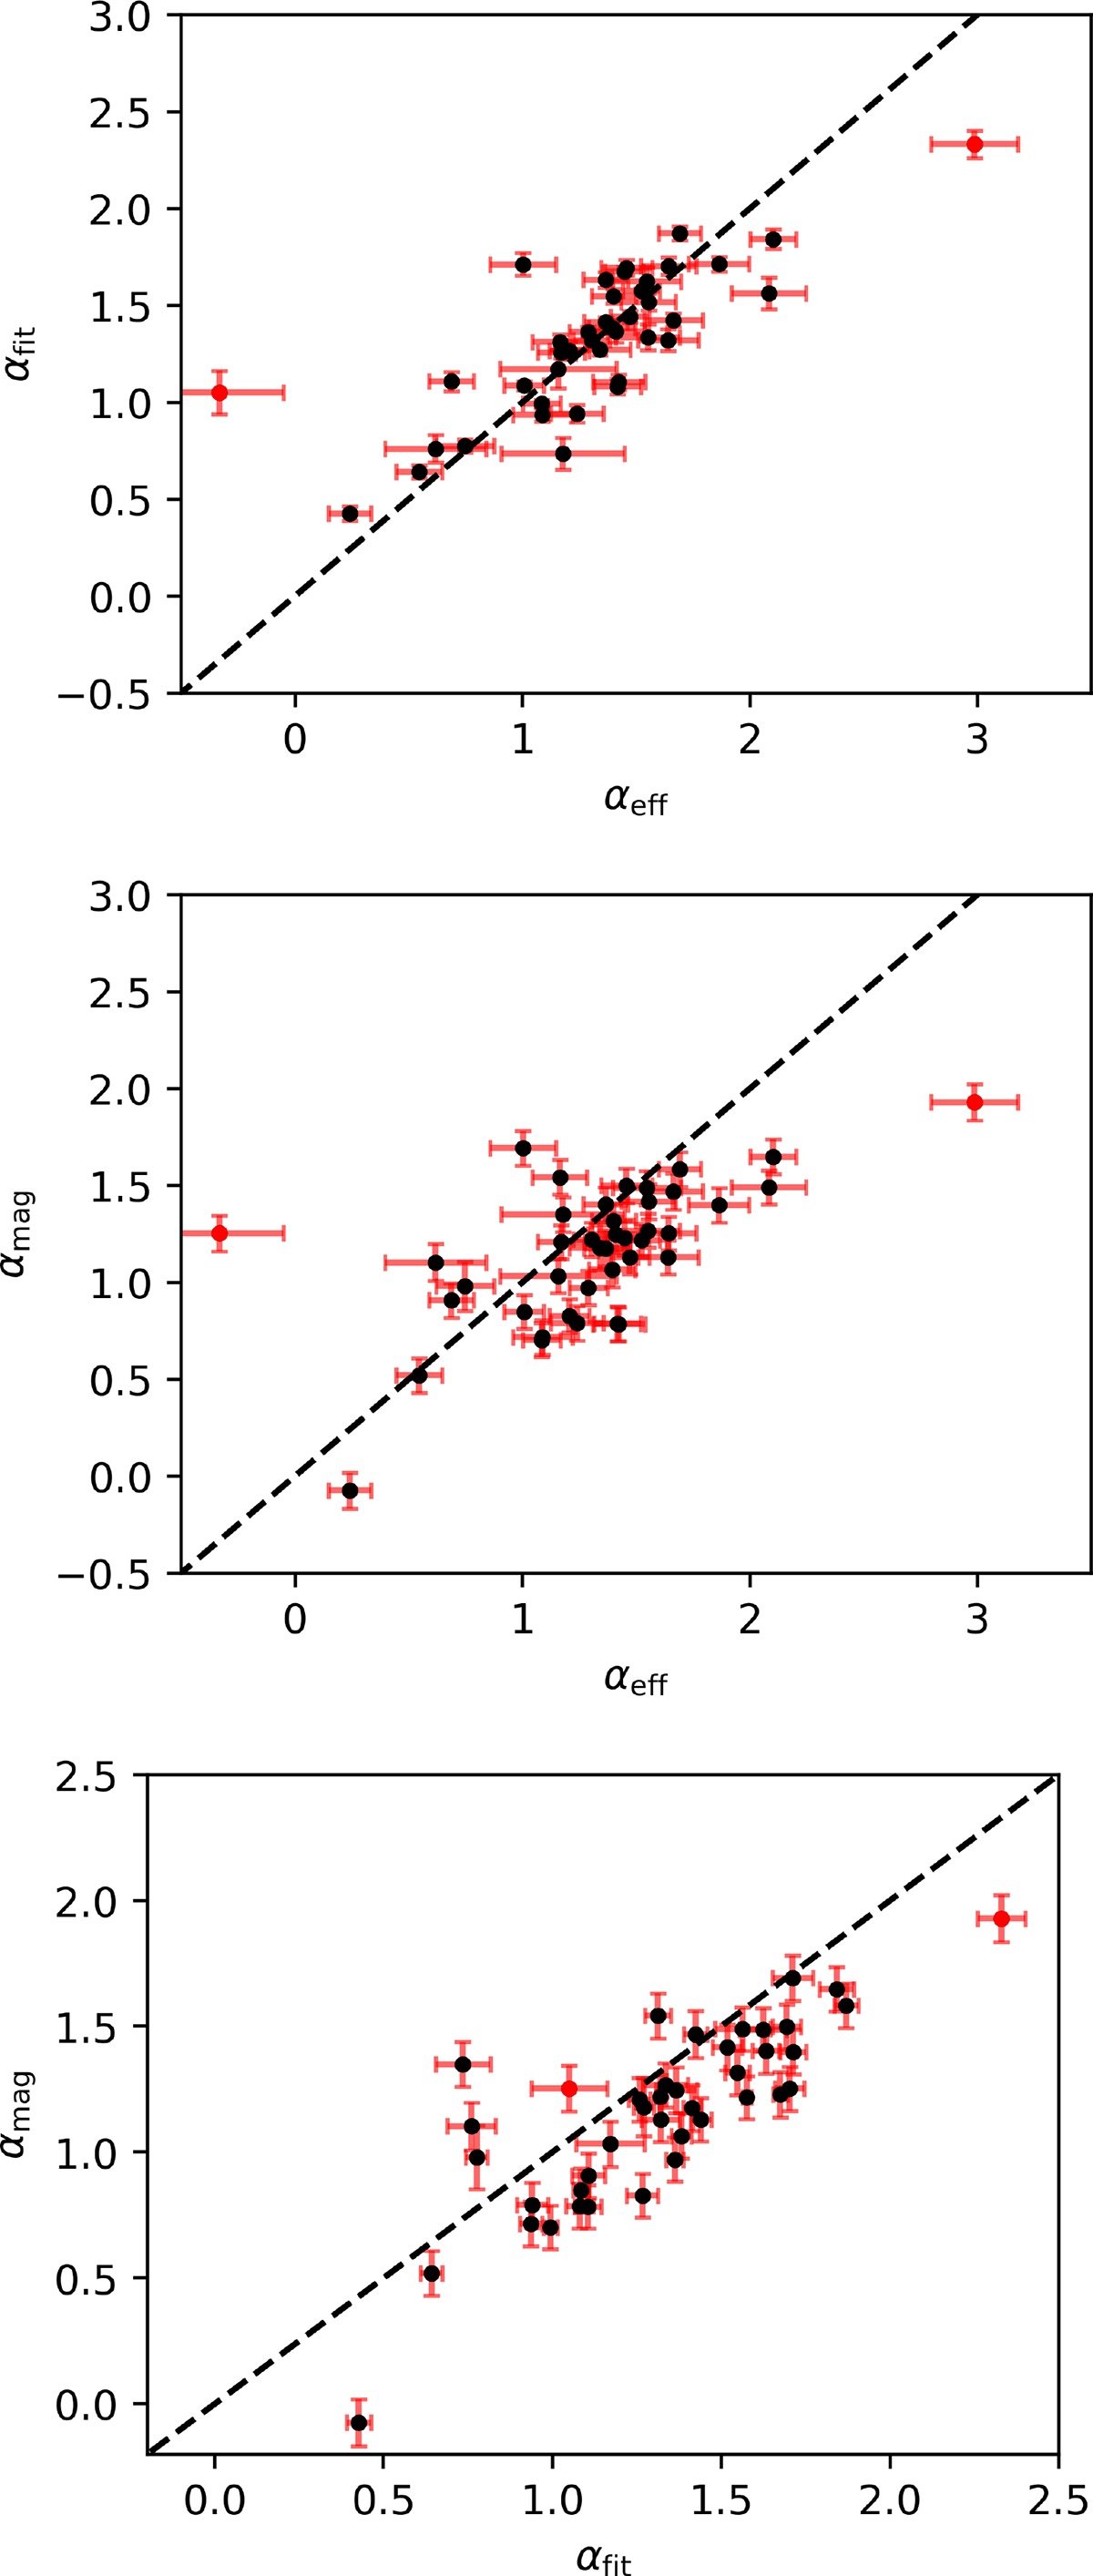
Fig. 3.
Download original image
Comparison of the spectral index α obtained with different methods for 41 quasar spectra. The dashed black line corresponds to the identity. The two red dots with a high deviation between their calculated αeff and the two other methods correspond to the two quasars with the lowest mean spectral flux densities.
Current usage metrics show cumulative count of Article Views (full-text article views including HTML views, PDF and ePub downloads, according to the available data) and Abstracts Views on Vision4Press platform.
Data correspond to usage on the plateform after 2015. The current usage metrics is available 48-96 hours after online publication and is updated daily on week days.
Initial download of the metrics may take a while.