Fig. 1.
Download original image
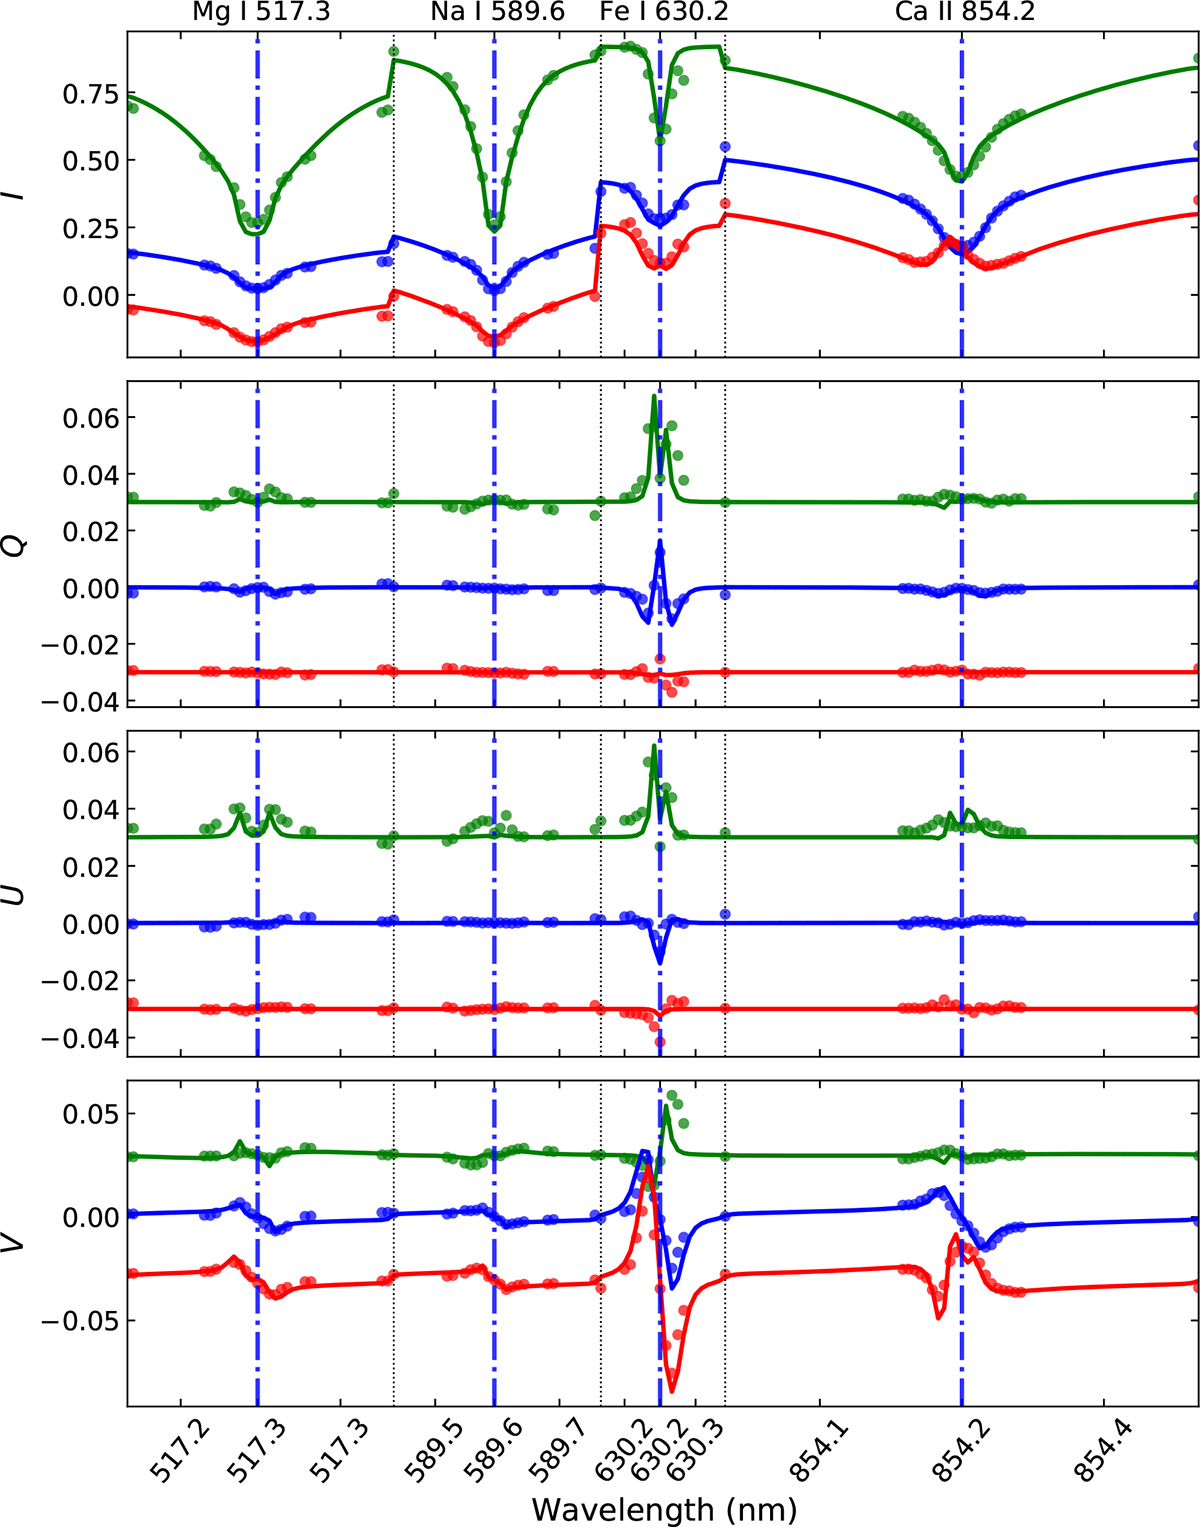
Representative Stokes profiles at three different locations in the diffraction limited observations. The three locations are: penumbra (green), umbra (blue), umbral flash (red). The points display the observed data whereas solid lines correspond to the fitted profiles. The profiles are normalized to the quiet sun continuum and to better visualize the data, vertical shifts have been applied. These are: [ + 0.2, 0, −0.2] in Stokes I and [ + 0.02, 0, −0.02] in Stokes Q, U and V. In addition, Stokes I signals in the umbra (blue) and umbral flash (red) have been multiplied by a factor of 2 before the shift is applied to better display the variations.
Current usage metrics show cumulative count of Article Views (full-text article views including HTML views, PDF and ePub downloads, according to the available data) and Abstracts Views on Vision4Press platform.
Data correspond to usage on the plateform after 2015. The current usage metrics is available 48-96 hours after online publication and is updated daily on week days.
Initial download of the metrics may take a while.