Open Access
Fig. 3.
Download original image
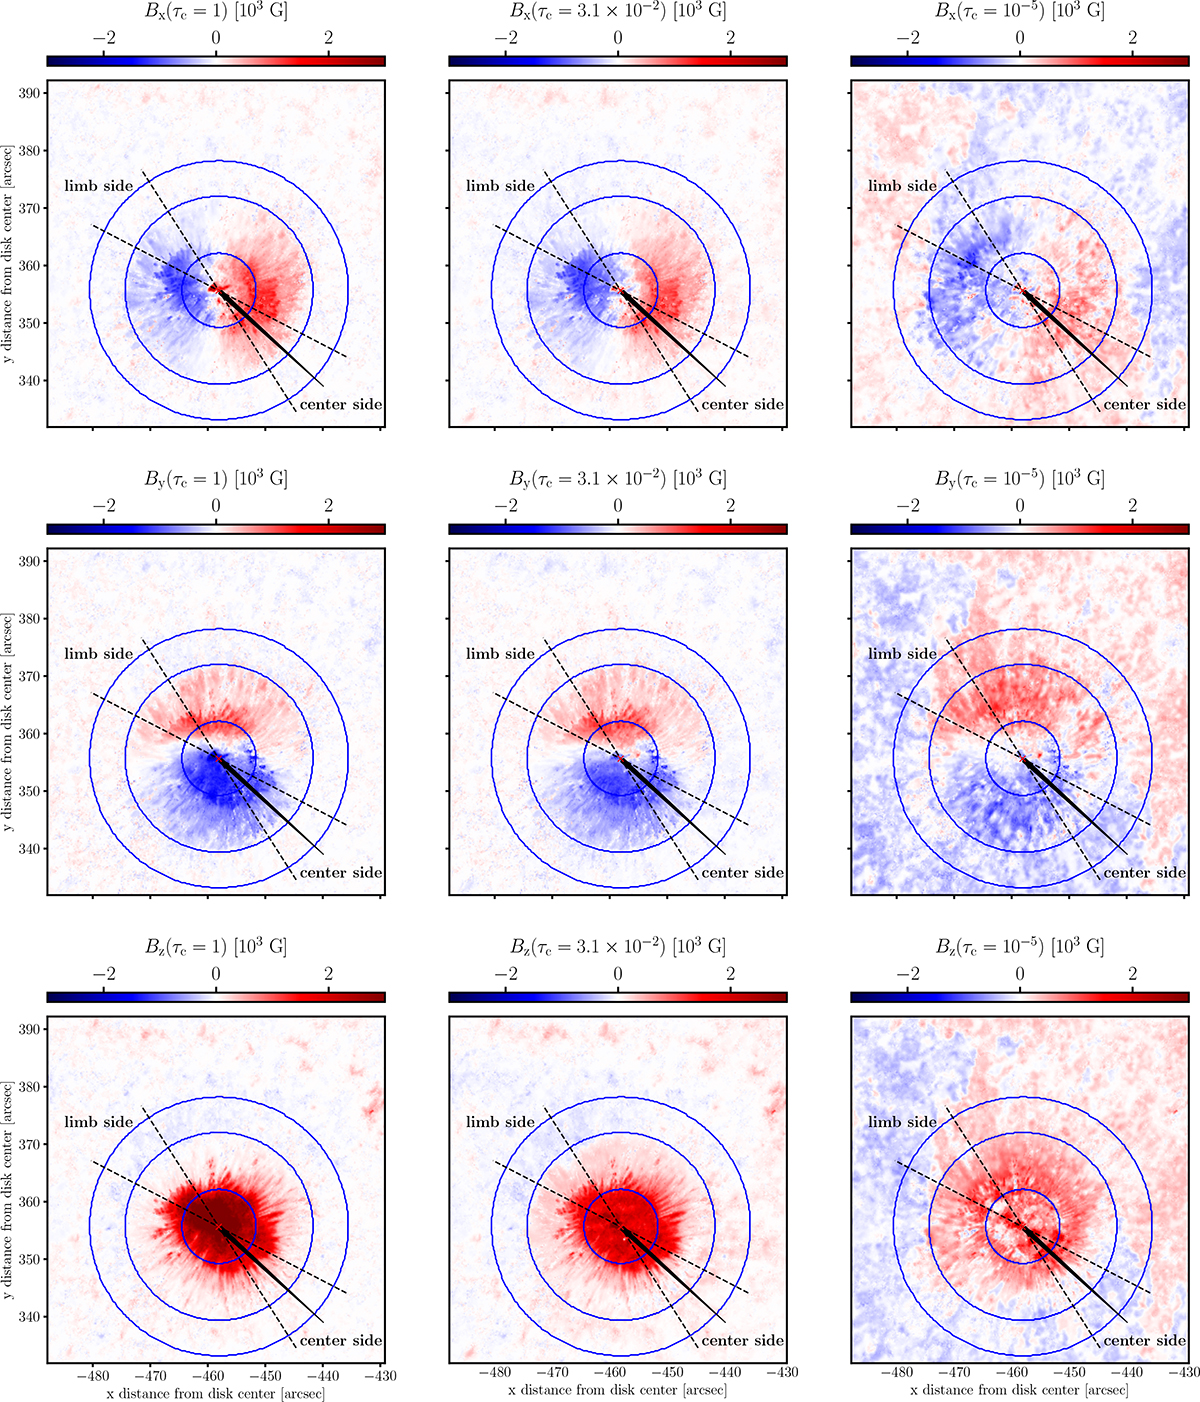
Inversion results. Similar to middle and bottom panels of Fig. 2 but displaying the Bx (top), By (middle) and Bz (bottom) components of the magnetic field in the local reference frame at three different optical depths.
Current usage metrics show cumulative count of Article Views (full-text article views including HTML views, PDF and ePub downloads, according to the available data) and Abstracts Views on Vision4Press platform.
Data correspond to usage on the plateform after 2015. The current usage metrics is available 48-96 hours after online publication and is updated daily on week days.
Initial download of the metrics may take a while.