Fig. 4.
Download original image
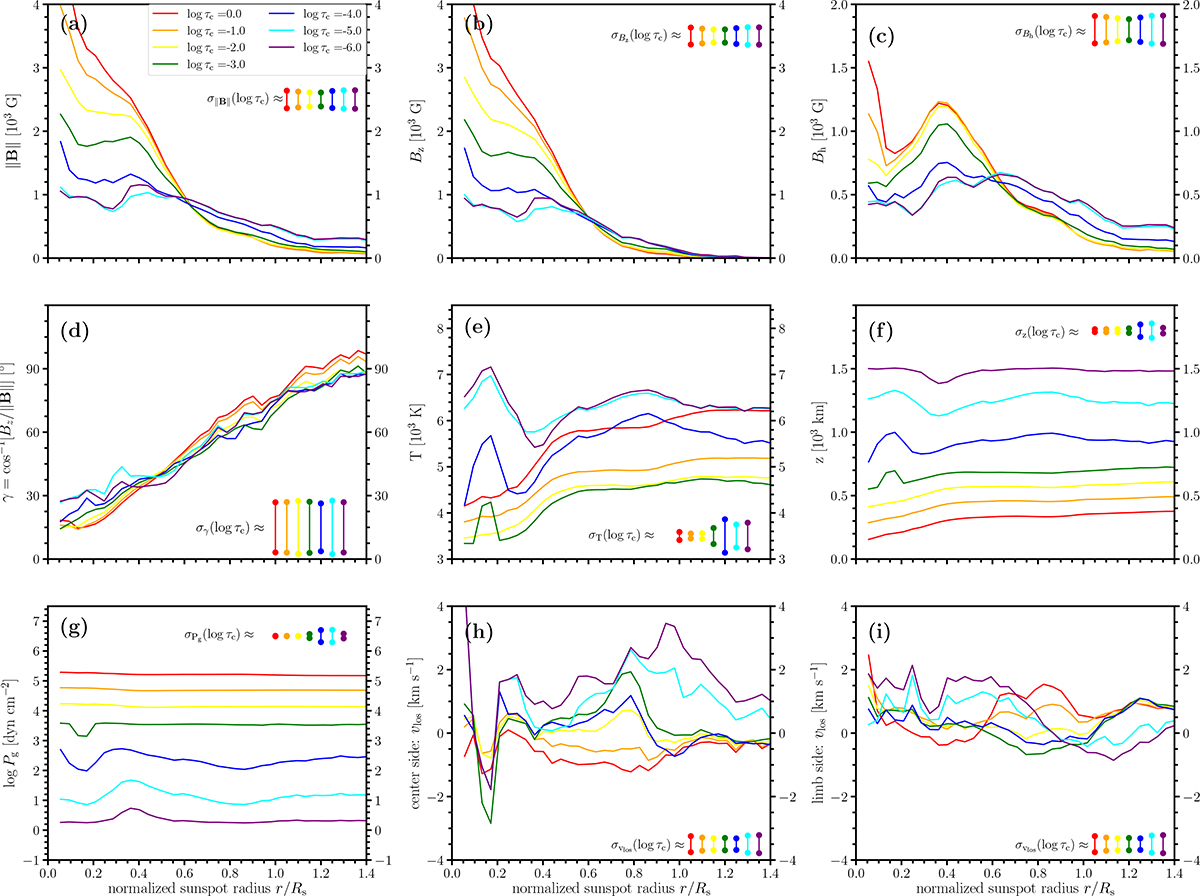
Average sunspot properties. Azimuthal averages of the physical parameters, as inferred from the Stokes inversion, as a function of the normalized sunspot radius r/Rs at different optical-depth levels: log τc = 0 (red), −1 (orange), −2 (yellow), −3 (green), −4 (blue), −5 (cyan), −6 (purple). Typical deviations around the mean are represented by the vertical colour bars. All panels, except (h) and (i) were produced by averaging over 2π radians. Panels h (vlos in the center side penumbra) and i (vlos in the limb side penumbra) were obtained by averaging only over ±π/12 radians around the sunspot’s line of symmetry (see cone denoted by dashed lines in Figs. 2 and 3).
Current usage metrics show cumulative count of Article Views (full-text article views including HTML views, PDF and ePub downloads, according to the available data) and Abstracts Views on Vision4Press platform.
Data correspond to usage on the plateform after 2015. The current usage metrics is available 48-96 hours after online publication and is updated daily on week days.
Initial download of the metrics may take a while.