Fig. 5.
Download original image
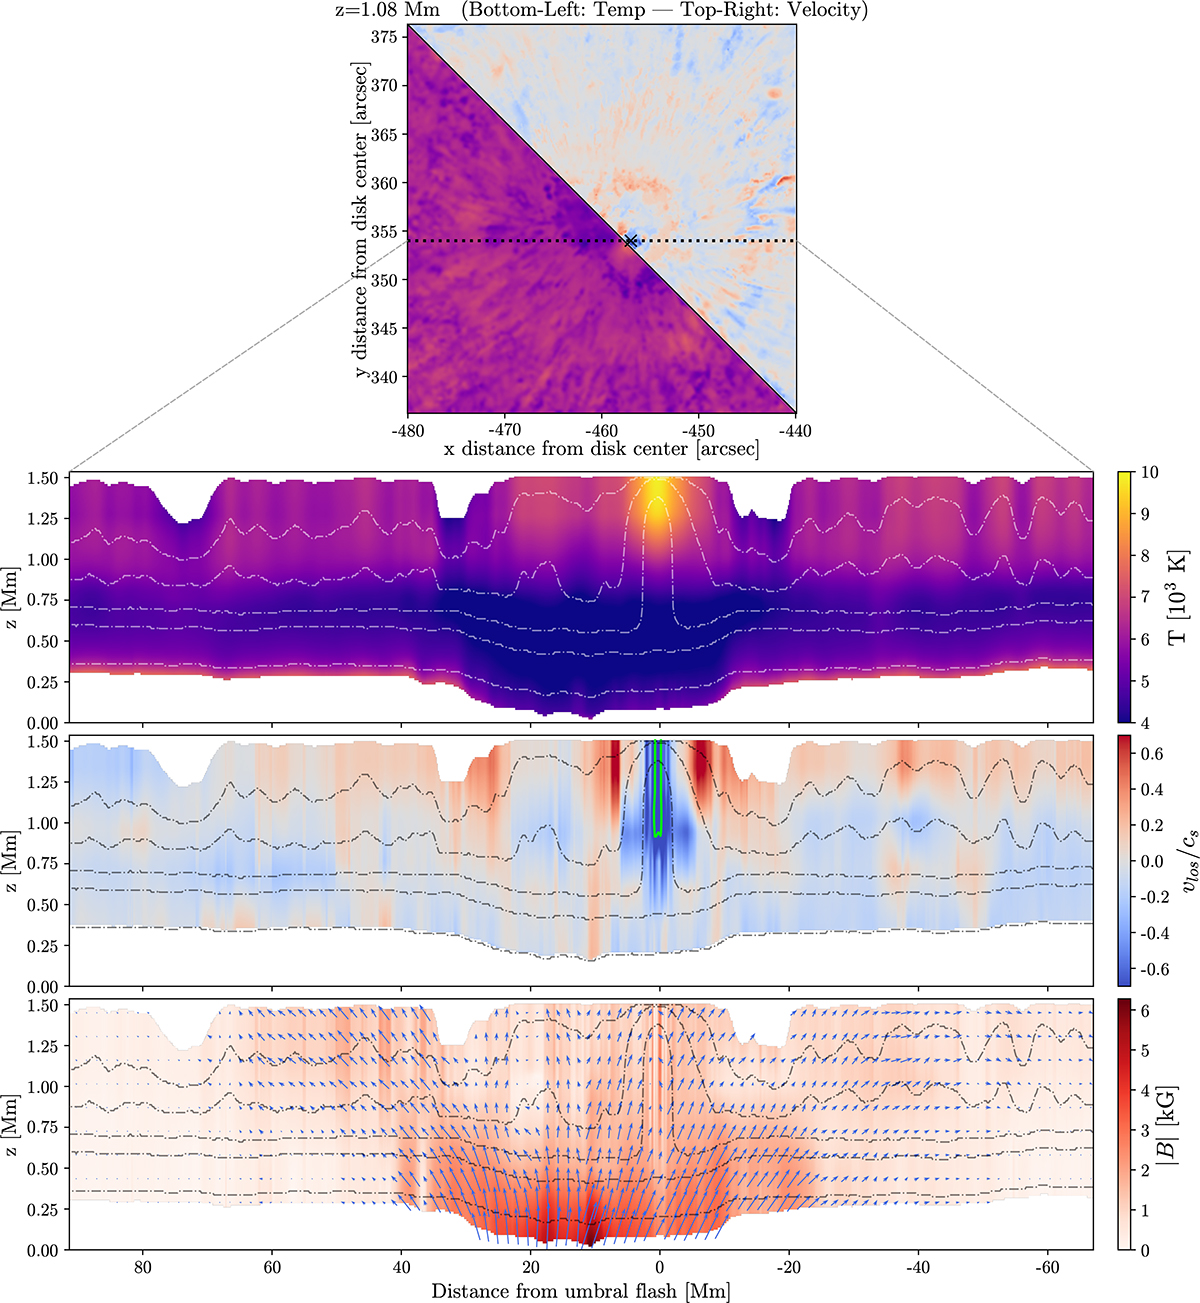
View of the umbral flash inferred from the diffraction limited data. Upper panel: Divided map of temperature T(x, y) (bottom left) and line-of-sight velocity vlos (top right) at z ∼ 1 Mm. The horizontal dotted line represents the slice selected for the three lower panels, and the cross indicates where the umbral flash happens (i.e. where the strongest supersonic velocities are found). Bottom panels: Temperature T(x, z), Mach number M(x, z), and magnetic field B(x, z) on the plane of the slice indicated on the upper panel (y = 88 Mm). As a reference, the curves of constant optical depth log τc = 0, −2, −3, −4, −5 are indicated by the dashed black or white lines. Green contours indicate the regions where supersonic flows are found: ∥M > 1∥.
Current usage metrics show cumulative count of Article Views (full-text article views including HTML views, PDF and ePub downloads, according to the available data) and Abstracts Views on Vision4Press platform.
Data correspond to usage on the plateform after 2015. The current usage metrics is available 48-96 hours after online publication and is updated daily on week days.
Initial download of the metrics may take a while.