Fig. C.1.
Download original image
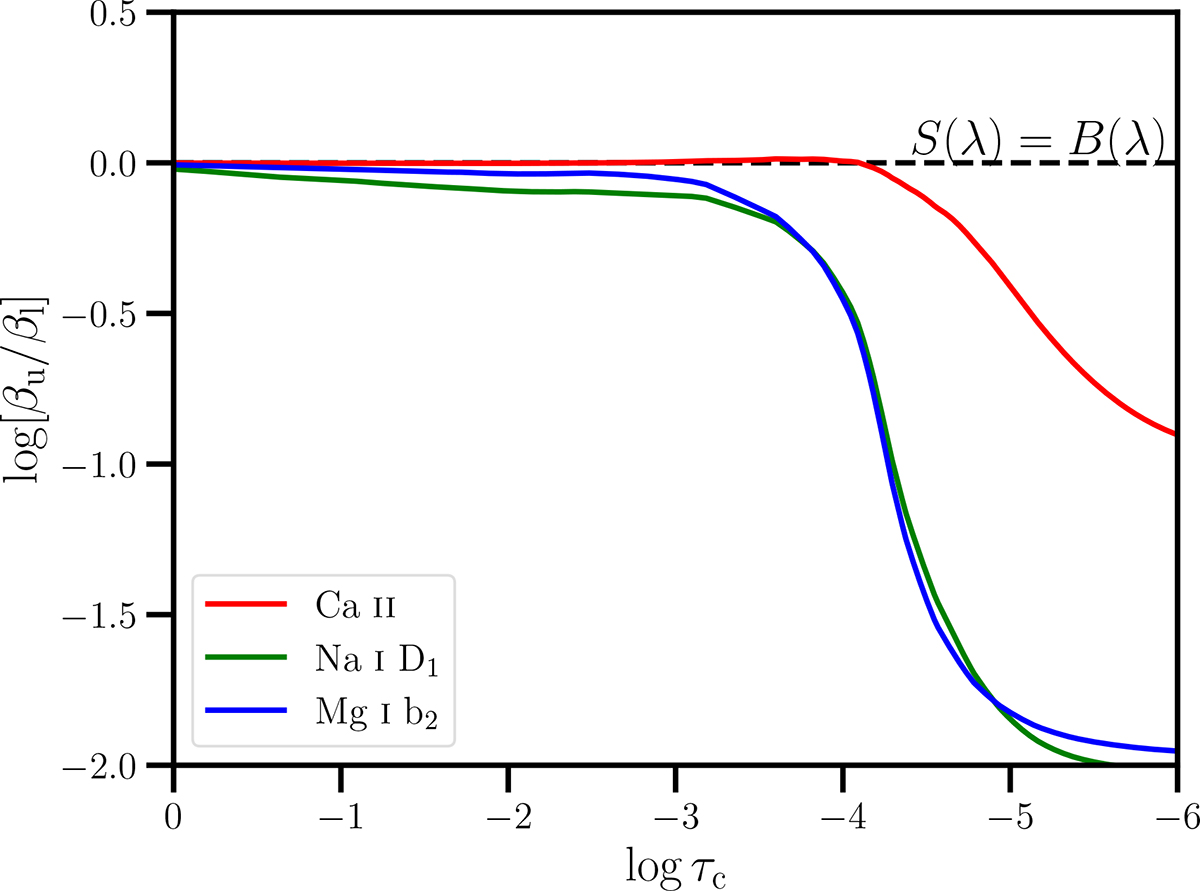
Departure coefficients for non-LTE spectral lines. This plots shows the dependence with optical depth log τc of the ratio of upper and lower level departure coefficients βu/βl. Color lines correspond to each of the analyzed spectral lines formed under non-LTE conditions: Mg I b2 (blue), Na I D1 (green) and Ca II (red). They were determined for the VALC model and used to initialize the inversion (see Sect. 3.1). The horizontal dashed line indicates the region where βu = βl and therefore the source function S(λ) corresponds to Planck’s function B(λ) (Sect. B).
Current usage metrics show cumulative count of Article Views (full-text article views including HTML views, PDF and ePub downloads, according to the available data) and Abstracts Views on Vision4Press platform.
Data correspond to usage on the plateform after 2015. The current usage metrics is available 48-96 hours after online publication and is updated daily on week days.
Initial download of the metrics may take a while.