Fig. 1.
Download original image
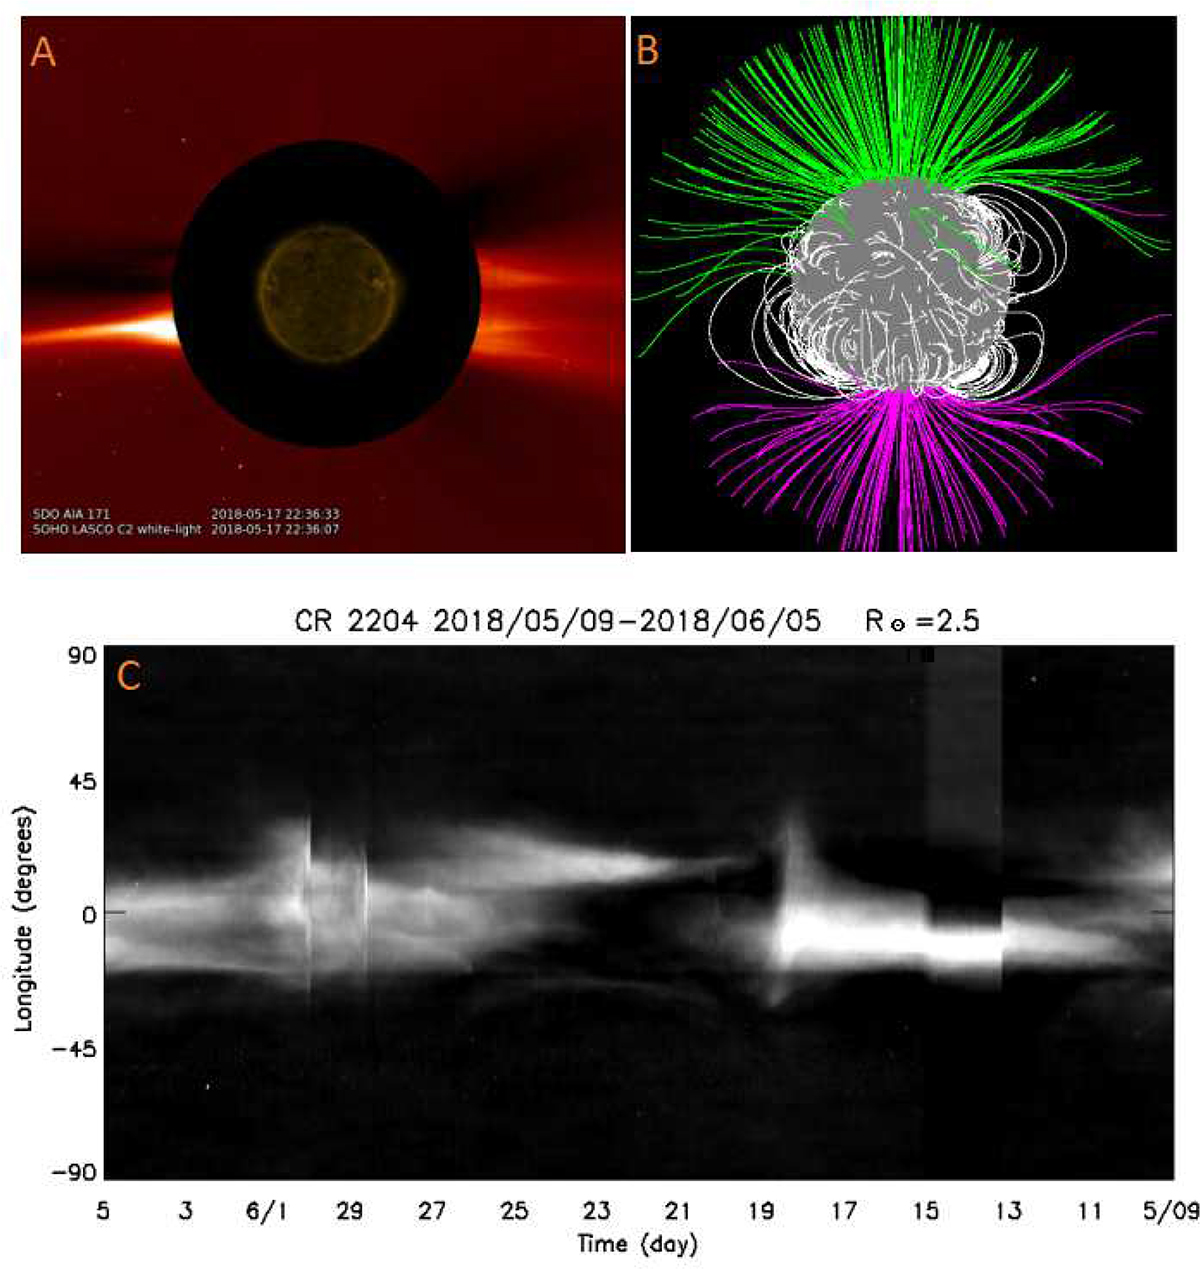
Example of the streamer classification. Panel A shows a composite image combining LASCO/C2 and AIA 171 Å images on 17 May 2018, from which the evolution in these observations allows us to determine whether there an active region exists at the streamer base. The streamer shown at the east limb (left side of the image) is an example of an ARS located above the active region of NOAA 12711 (as seen in the AIA 171 Å image). Panel B shows the PFSS model closest in time to the same day, which helps us to confirm that the streamer is a helmet streamer. Panel C is the Carrington map of solar rotation 2204, which is used to determine the time range of this helmet streamer (10–19 May 2018 for this case).
Current usage metrics show cumulative count of Article Views (full-text article views including HTML views, PDF and ePub downloads, according to the available data) and Abstracts Views on Vision4Press platform.
Data correspond to usage on the plateform after 2015. The current usage metrics is available 48-96 hours after online publication and is updated daily on week days.
Initial download of the metrics may take a while.