Fig. 2.
Download original image
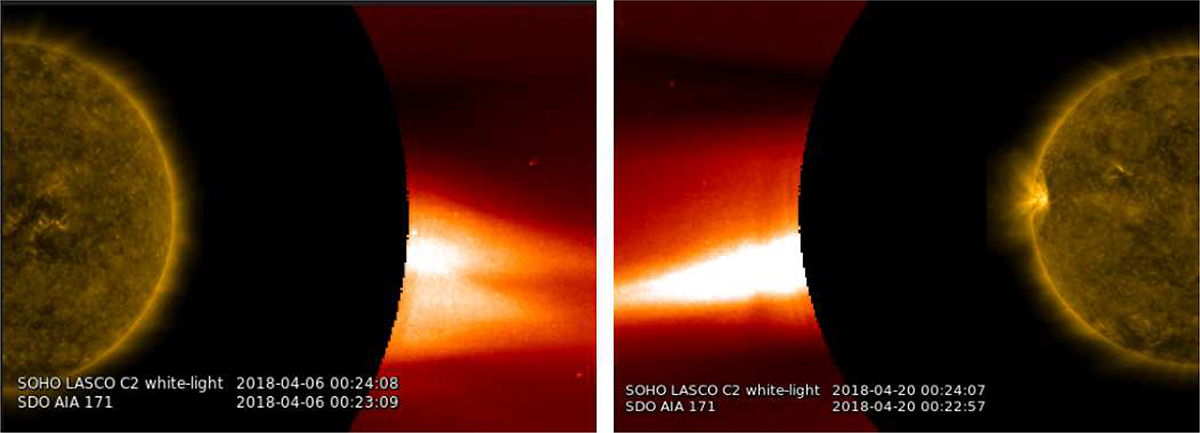
LASCO/C2 and AIA 171 Å composite images of a QES (left panel) and an ARS (right panel). In the left panel, the QES is visible at the west limb, where no active region is visible at its base throughout its lifetime (see the AIA 171 Å observations). In the right panel, the ARS is visible at the east limb, with an active region (NOAA 12706) at its base. All times denoted in the figures refer to universal time (UT).
Current usage metrics show cumulative count of Article Views (full-text article views including HTML views, PDF and ePub downloads, according to the available data) and Abstracts Views on Vision4Press platform.
Data correspond to usage on the plateform after 2015. The current usage metrics is available 48-96 hours after online publication and is updated daily on week days.
Initial download of the metrics may take a while.