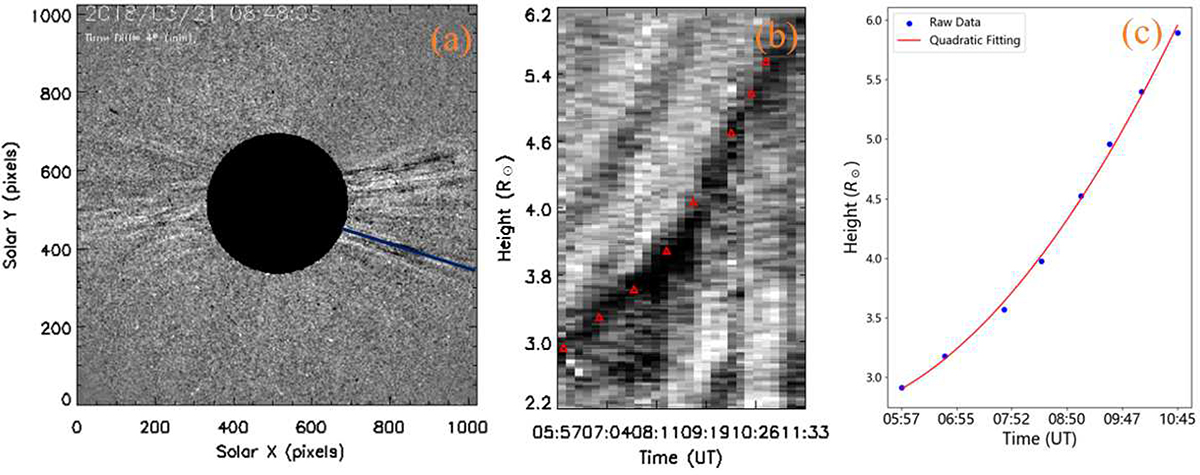
Fig. 3.
Download original image
Example showing how we obtained the parameters of a streamer blob. Panel (a) shows a running-difference image of LASCO/C2, where the dark blue line marks the propagating path of a streamer blob. Panel (b) is a time-distance diagram obtained along the dark blue line marked in panel (a) based on the running-difference images. The propagation of the blob is shown as the dark feature and the bright one above, marked by red triangles. Based on the trajectory of the blob shown in panel (b), a fitting curve was obtained using the quadratic fitting method, as shown in panel (c).
Current usage metrics show cumulative count of Article Views (full-text article views including HTML views, PDF and ePub downloads, according to the available data) and Abstracts Views on Vision4Press platform.
Data correspond to usage on the plateform after 2015. The current usage metrics is available 48-96 hours after online publication and is updated daily on week days.
Initial download of the metrics may take a while.