Open Access
Fig. 7.
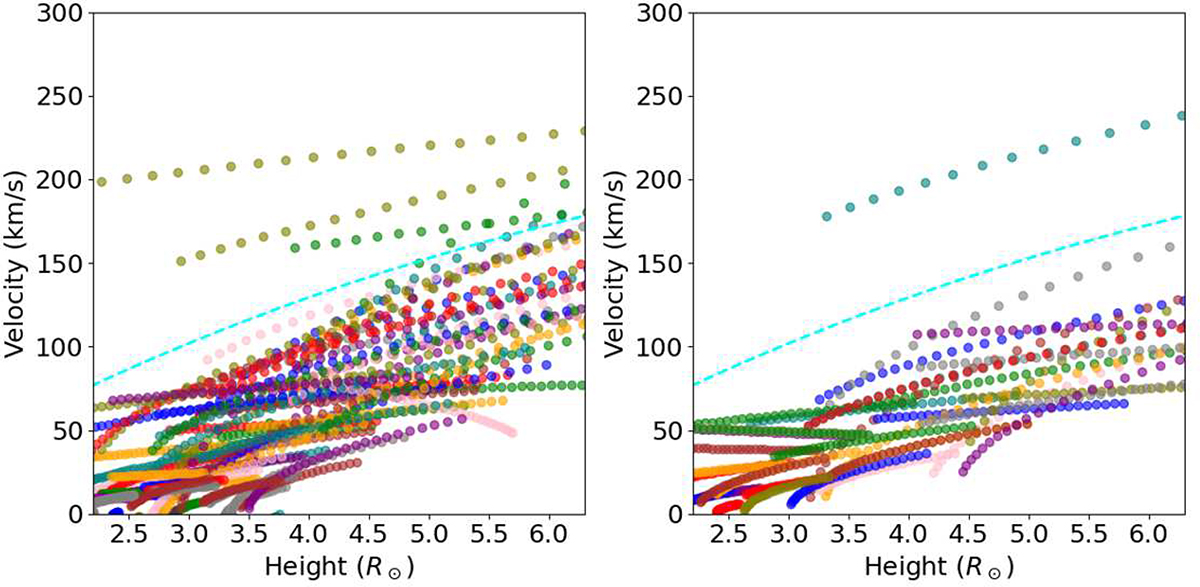
Download original image
Velocity as a function of height for 112 individual ARS blobs (left panel) and for 55 QES blobs (right panel). Each individual blob is traced by a solid circle of the same color. The cyan lines represent the solar wind speeds given by the Paker model (Parker 1958).
Current usage metrics show cumulative count of Article Views (full-text article views including HTML views, PDF and ePub downloads, according to the available data) and Abstracts Views on Vision4Press platform.
Data correspond to usage on the plateform after 2015. The current usage metrics is available 48-96 hours after online publication and is updated daily on week days.
Initial download of the metrics may take a while.