Fig. 8.
Download original image
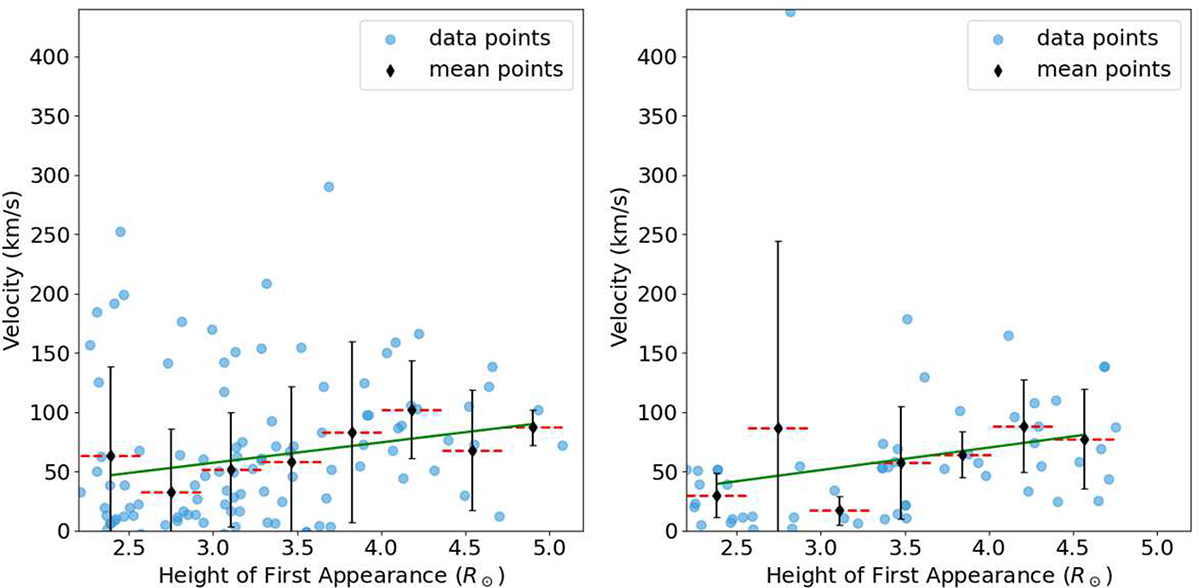
Scatter diagrams for initial velocities vs. heights of first appearance of the ARS blobs (left panel) and of the QES blobs (right panel). Each blue circle represents an individual blob. A black diamond shows the average value obtained in a segment of 0.4 R⊙ (marked by the dashed red line), and the error bar in black denotes the 1σ error. The solid green line shows a linear fit to the segmented average values vs. height, which gives y = 17.2x + 5.7 for the left panel and y = 18.9x − 5.5 for the right panel.
Current usage metrics show cumulative count of Article Views (full-text article views including HTML views, PDF and ePub downloads, according to the available data) and Abstracts Views on Vision4Press platform.
Data correspond to usage on the plateform after 2015. The current usage metrics is available 48-96 hours after online publication and is updated daily on week days.
Initial download of the metrics may take a while.